Figures & data
Table 1 Sample Characteristics
Table 2 Descriptive Statistics for Continuously Measured Variables
Table 3 Gender Differences in Life Satisfaction (SWLS), Dispositional Optimism (LOT-R), and Health Behaviors (HBI)
Table 4 Pearson’s r Correlations Between Life Satisfaction, Dispositional Optimism and Health Behaviors
Figure 1 Standardized path coefficients for the relationship between life orientation and life satisfaction as mediated by general health behaviors.
Notes: The a1-path represents the impact of the independent variable (IV = dispositional optimism) on the mediator variable (M = health behaviors). The b1-path represents the impact of the mediator on the dependent variable (DV = life satisfaction). The c1-path represents the total effect of IV on the DV and c’ represents the direct effect of IV on DV accounting for the indirect effect of a mediator. ***p < 0.001.
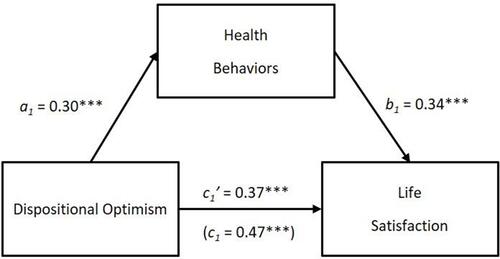
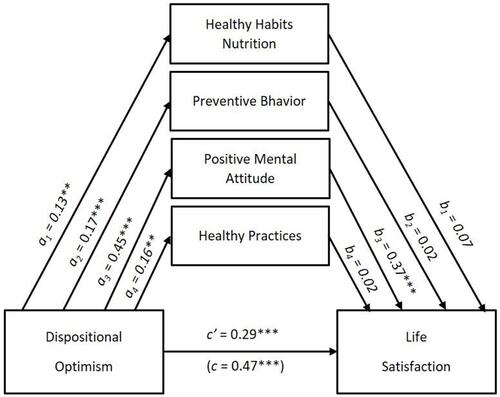
Figure 2 Standardized path coefficients for the relationship between life orientation and life satisfaction as mediated by four types of health behaviors.
Notes: The a-path represents the impact of the independent variable (IV) on the mediator variable (M). The b-path represents the impact of the mediator on the dependent variable (DV). The c-path represents the total effect of IV on the DV and c’ represents the direct effect of IV on DV accounting for the indirect effect of a mediator. **p < 0.01. ***p < 0.001.