
Figures & data

Figure 1 Pearson product–moment correlations between each variable.
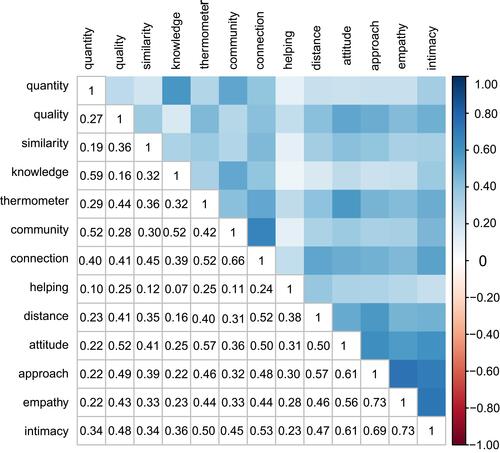
Table 1 Mean, Standard Deviation (SD), Minimum (Min), Maximum (Max), Skewness, and Kurtosis of Each Variable (Before Nonparanormal Transformation)
Figure 2 Graphical Gaussian model network constructed via the graphical LASSO.
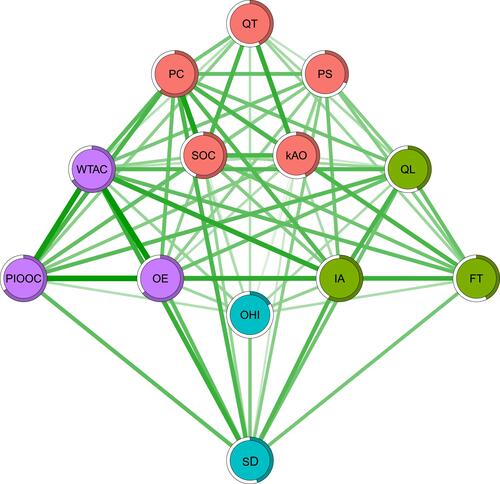
Figure 3 Centrality estimates of intergroup contact depicting strength, betweenness, and closeness.
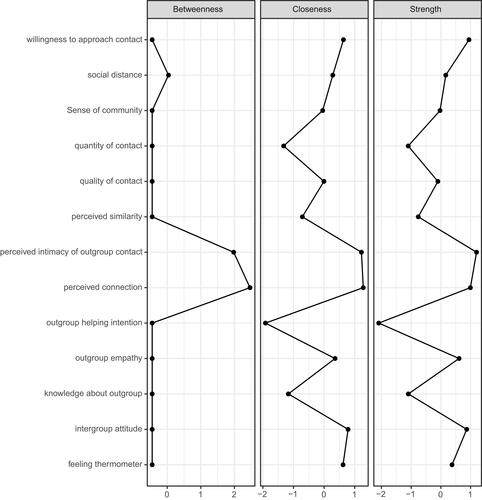
Figure 4 Bootstrapped confidence intervals of estimated edge – weights for the estimated network of intergroup contact.
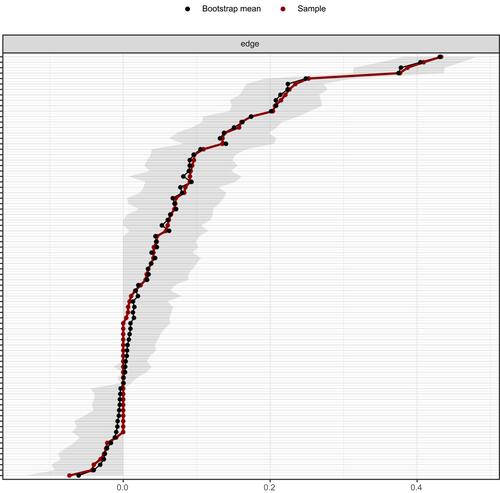
Figure 5 Bootstrapped difference of estimated edge – weights for the estimated network of intergroup contact.
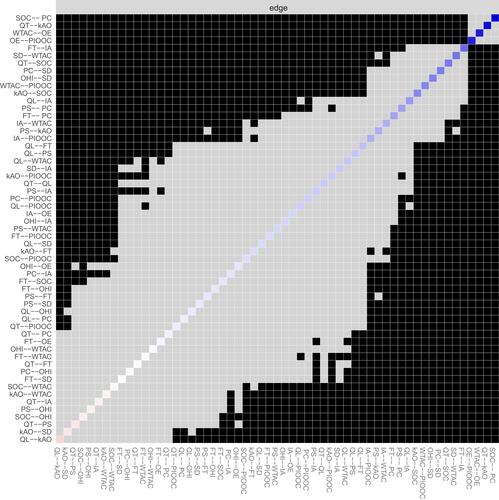
Figure 6 Average correlations between centrality indices of networks sampled with case dropped and the original sample.
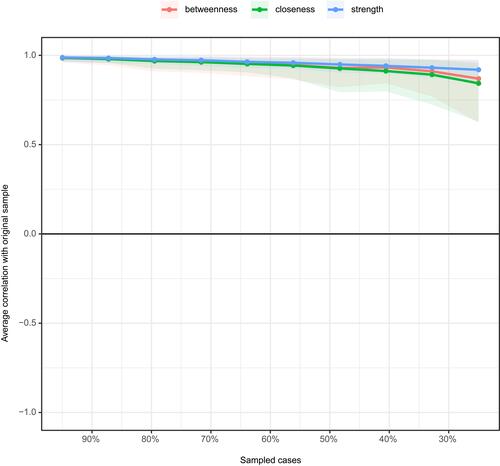
Figure 7 Bootstrapped difference of strength for the estimated network of intergroup contact.
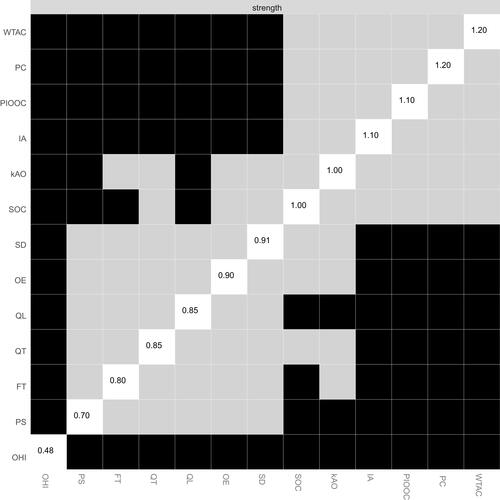
Figure 8 Average correlations between bridge strength of networks sampled with case dropped and the original sample.
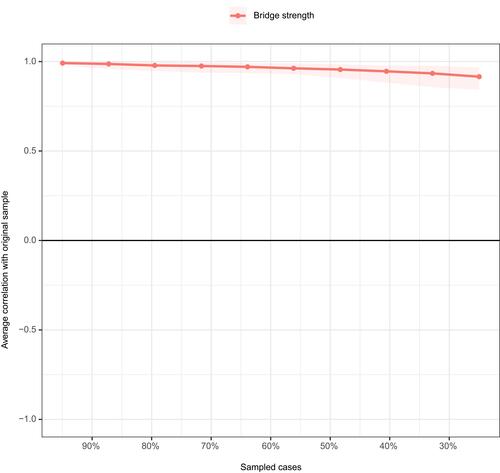
Table 2 Accumulated Bridge Strength for Each Community