
Figures & data
Table 1 The Original Questionnaire “Contact with the Elderly”
Table 2 Characteristics of Study Participants (N=923)
Figure 1 Posterior medians (points and blue line) of the predicted mean KAOP scores as a function of credible predictors. Vertical lines and shaded area are 95% credible intervals.
Note: KAOP and Facts of aging are shown on standardized scales. Grey transparent points show data.
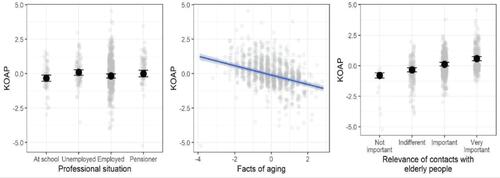
Table 3 Results of Bayesian Robust Linear Regression with KAOP Score as a Dependent Variable