
Figures & data
Table 1 Characteristics of the Caregivers and the Patients
Table 2 Exploratory Factor Loadings of Items in CBS with Five Factors
Figure 1 The result of the CFA of the final five-factor model with residual correlations. Fit measures: chi square (df 194) = 505.2, p = 0.001), chi square/df = 2.6, 1, RMSEA = 0.066, 90% CI (0.059–0.073); SRMR = 0.053, NNFI = 0.898, CFI = 0.915.
Note: The items are numbered according to their order in the original subscales of the CBS.
Abbreviations: GS, General strain; I, Isolation; D, Disappointment; EI, Emotional involvement; E, Environment.
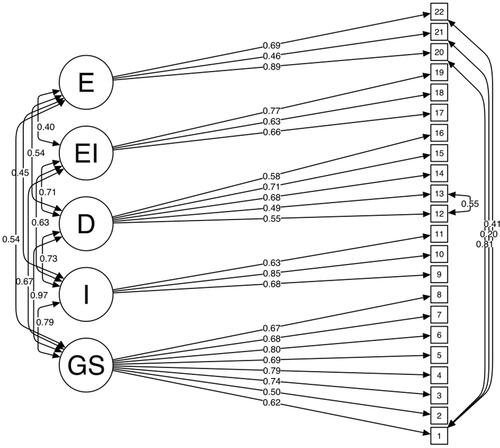
Figure 2 A network plot presenting the partial correlations between the Caregiver Burden Scale items.
Notes: Blue lines indicate positive correlations, whilst red lines indicate negative correlations. The thickness of lines connecting the nodes is proportional to the strength of the relationships (partial correlation coefficients) between the CBS items (represented by circles). The range of relationships: 0.10–0.53. The items are numbered according to their order in the original subscales of the CBS.
Abbreviations: GS, General strain; I, Isolation; D, Disappointment; EI, Emotional involvement; E, Environment.
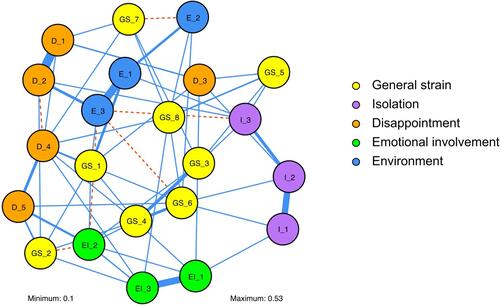
Table 3 Pearson Correlation Coefficients Between CBS and HADS Scores in Caregivers of Stroke Patients
Table 4 Reliability Analyses of the Caregiver Burden Scale