
Figures & data
Figure 1 Flow diagram of the study.
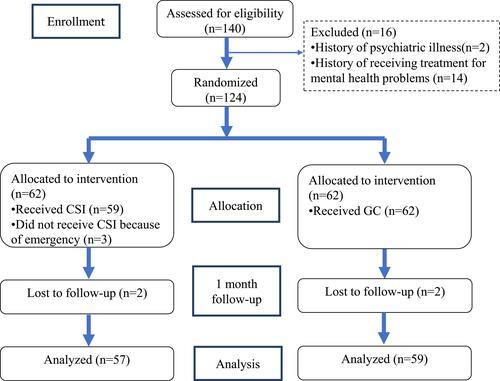
Table 1 Baseline Demographic and Socio-Economic Characteristics of the Study Participants Included in the Analysis
Figure 2 Mean and 95% CI of positive growth score between two groups.
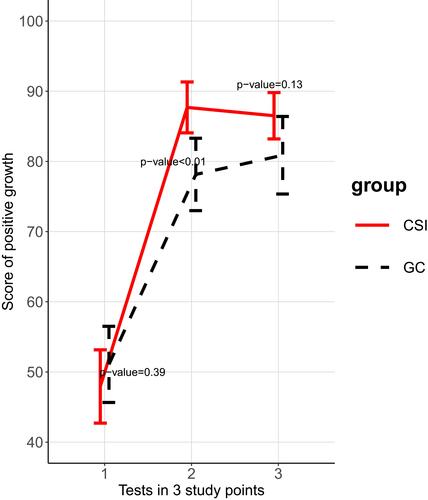
Figure 3 Mean and 95% CI of well-being score between two groups.
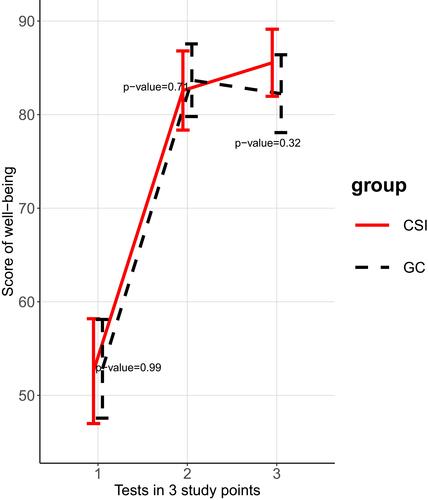
Figure 4 Mean and 95% CI of depression score between two groups.
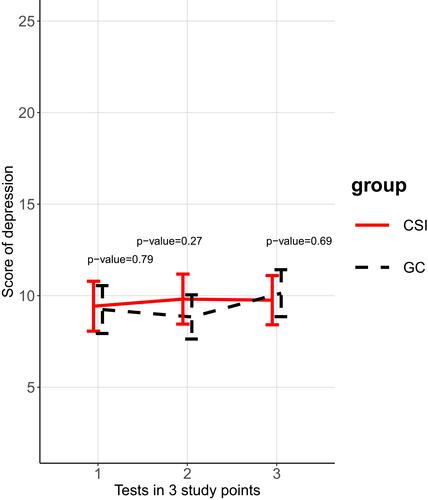
Table 2 Outcomes Scores at Three Study Points, Mean Changes in Each Group Comparing to Baseline and Adjust Difference in Changes Between Groups