Figures & data
Table 1 Sociodemographic Distribution (No. = 541)
Table 2 Spearman Correlation Between Different Sociodemographic Factors and the Mean Scores of Fear, the Total Scores of Anxiety and Depression in the Whole Tested Population (No: 541)
Figure 1 Graphical presentation of ANOVA and post-hoc test results for fear scores (only significant differences are marked). Data are presented as mean ± SD. (A) Age (P-value by ANOVA = 0.034). (B) Work region (P-value by ANOVA = 0.014). (C) Job (P-value by ANOVA <0.0001).
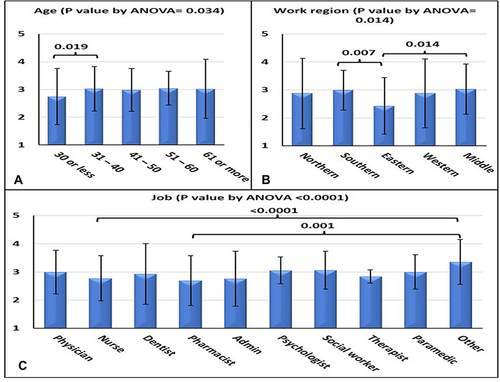
Figure 2 Graphical presentation of ANOVA and post-hoc test results for anxiety scores (only significant differences are marked). Data are presented as mean ± SD. (A) Age (P-value by ANOVA = 0.020). (B) Work region (P-value by ANOVA <0.0001). (C) Workplace (P-value by ANOVA = 0.003). (D) Job (P-value by ANOVA <0.0001). (E) Work hours (P-value by ANOVA <0.0001).
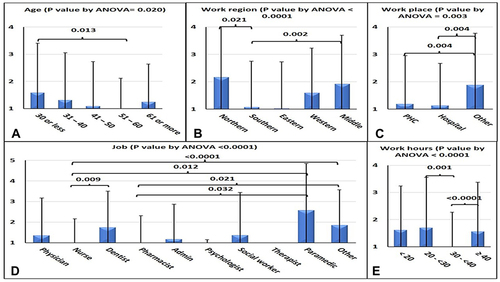
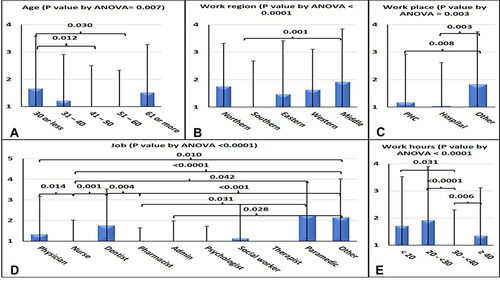
Figure 3 Graphical presentation of ANOVA and post-hoc test results for depression scores (only significant differences are marked). Data are presented as mean ± SD. (A) Age (P-value by ANOVA = 0.007). (B) Work region (P-value by ANOVA <0.0001). (C) Workplace (P-value by ANOVA = 0.003). (D) Job (P-value by ANOVA <0.0001). (E) Work hours (P-value by ANOVA <0.0001).