Figures & data
Figure 1 Hypothetical model diagram of the relationship between perceived parental autonomy support and academic procrastination.
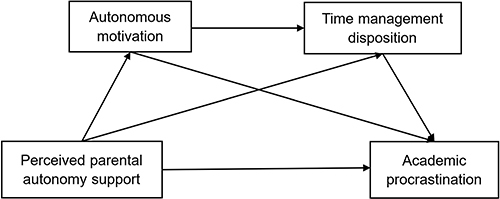
Figure 2 Statistical diagram of PROCESS model 6.
Notes: The mediating effect of M1 = a1*b1. The mediating effect of M2 = a2*b2. The chain mediating effect of M1 and M2 = a1*d21*b2. The direct effect of X on Y = c’. The total effect of X on Y = a1*b1 + a2*b2 + a1*d21*b2 + c’.
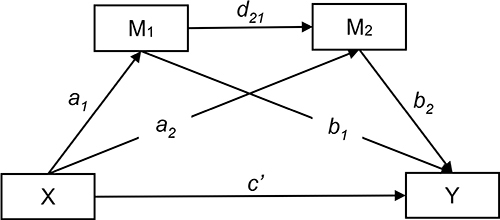
Table 1 Descriptive Statistics and Correlations for the Main Variables
Table 2 Regression Analysis of the Relationship Between Variables
Table 3 Mediating Effect Analysis
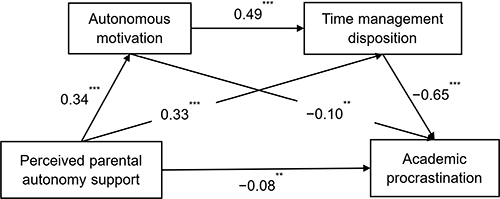
Figure 3 Paths for how perceived parental autonomy support predicts academic procrastination.
Notes: The numbers represent standardized regression coefficients (β). **p < 0.01, ***p < 0.001.