
Figures & data
ROC curve analysis for predicting severe perceived stress (>3) (A) ROC curve for USS-10; (B) ROC curve for USS-4.
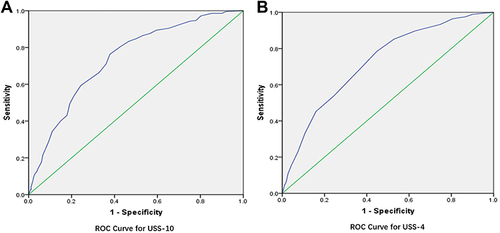
Table 1 Overview of the Demographic Characteristics of the Sample
Table 2 Overview of the Results for Validity and Reliability Analysis for USS-4 and USS-10
Table 3 Overview of the Intercorrelations Between Uncertainty Stress Scale Items
Table 4 Overview of the Factor Loadings and Reliability Analysis for the 10-Item Uncertainty Stress Scale (USS-10)
Table 5 Overview of the Factor Loadings and Reliability Analysis for 4-Item Uncertainty Stress Scale (USS-4)
Table 6 Overview of the Goodness-of-Fit Indices of USS-10 and USS-4
Table 7 Overview of the Results of the Correlation Analysis Between Different Scale Scores
Table 8 Overview of the Results of ROC Curve Analysis