Figures & data
Table 1 Means (M), Standard Deviations (SD), and Correlation of the Variables
Table 2 Prevalence and Severity of Depression Symptoms by Country
Table 3 Hierarchical Regression Analyses for All Participants
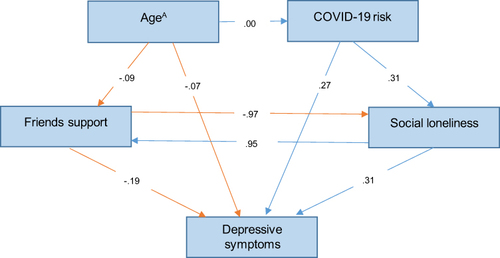
Figure 1 Depression structural equation model for the total sample (India, Poland and the United Kingdom).
Notes: A(1 = 18–24; 2 = 25 and older); Fitting of the model: RMSEA = 0.04; χ2 = 2.24, df = 1; CFI = 0.99; AIC = 30.23.
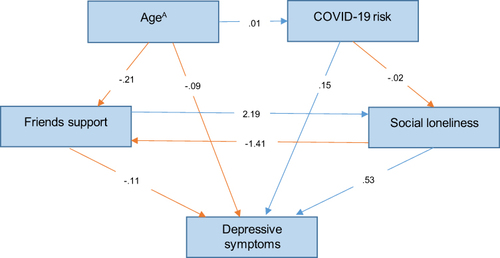
Figure 2 Depression structural equation model for the Polish sample.
Notes: A(1 = 18–24; 2 = 25 and older); Fitting of the model: RMSEA = 0.00; χ2 = 2.24 df = 1; CFI = 1.00; AIC = 28.00.
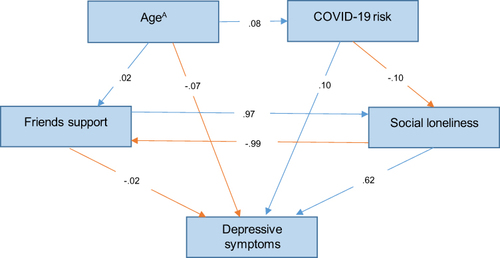
Figure 3 Depression structural equation model for the United Kingdom sample.
Notes: A(1 = 18–24; 2 = 25 and older); Fitting of the model: RMSEA = 0.21; χ2=10.09, df = 1; CFI = 0.93; AIC = 38.09.
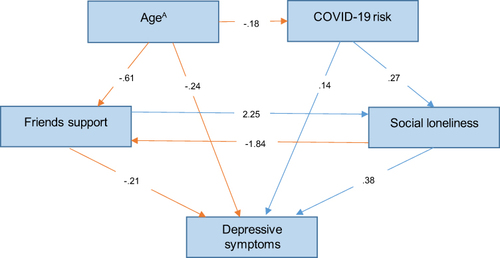
Figure 4 Depression structural equation model for the Indian sample.
Notes: A(1= 18–24; 2=25 and older); Fitting of the model: RMSEA = 0.07; χ2 = 1.99; CFI = 0.99; AIC = 29.99.