Figures & data
Table 1 Demographic Information of Participants
Figure 1 The average score of different perceived stress.
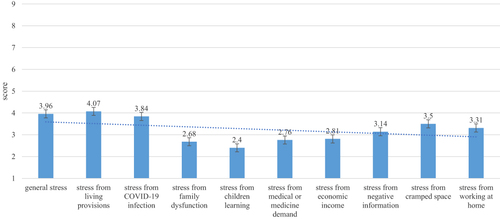
Figure 2 The average score of different negative emotion states.
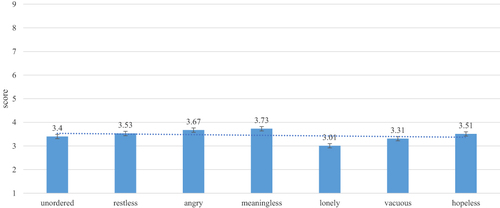
Table 2 Perceived Stress and Negative Emotion State by Demographic Information
Table 3 Regression Analyses with Perceived Stress Score as the Dependent Variable
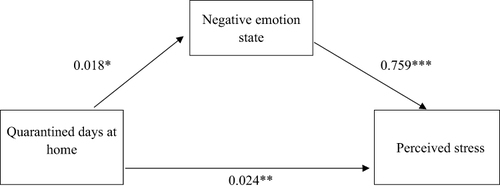
Figure 3 Negative emotion state mediates the relationship between quarantined days at home and perceived stress.
Note: * p<0.05; ** p<0.01; *** p<0.001.