Figures & data
Figure 1 Flow diagram of experiment.
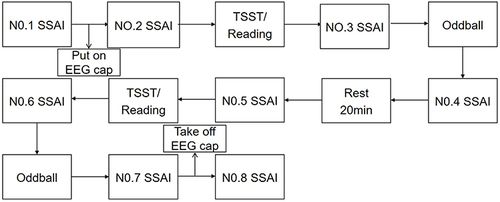
Figure 2 Two-choice oddball task.
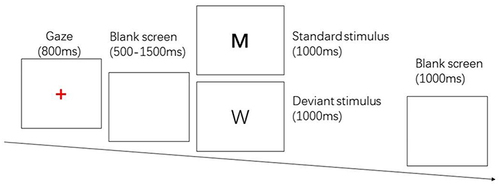
Table 1 Comparison of SSAI Scale Scores Between Subjects in Stress and Neutral States at Different Time Points [()]
Table 2 Comparison of the Power of the Alpha and Theta Frequency Bands of the Two Stimuli in the Stress and Neutral States [()]
Figure 3 Standard stimuli: response time is longer in the stress state than in the neutral state; deviant stimuli: no statistically significant difference in response time between the stress and neutral states. Stress and neutral states: reaction time of deviant stimuli was longer than that of standard stimuli. *P<0.05; **P<0.01; ***P<0.001.
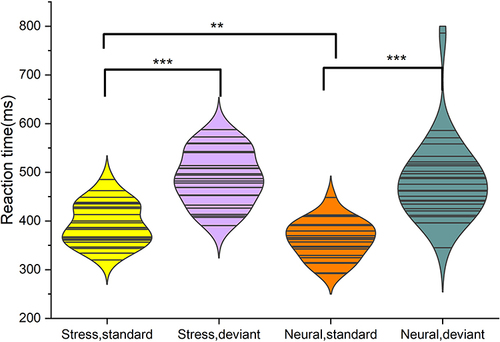
Figure 4 Number of errors: less in the stress state than in the neutral state. Number of errors in the neutral state: standard stimuli less than deviant stimuli. *P<0.05.
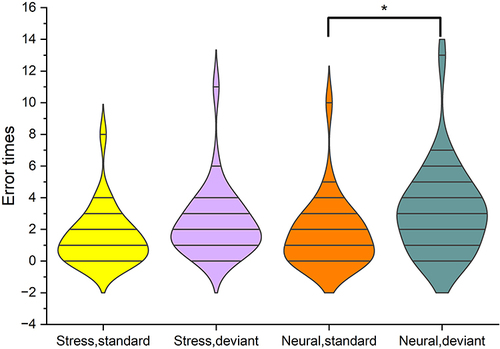
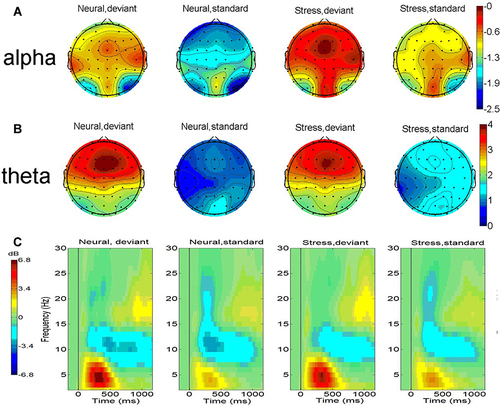
Figure 5 (A) Topographical maps of alpha power (dB, 8–13Hz, 100–400ms); (B) theta power (dB, 4–8Hz, 200–400ms); (C) time -frequency plots at the electrode Fz. (1) Deviant stimuli evoked smaller alpha power compared to standard stimuli and stressed states elicited smaller alpha power compared to neutral states. (2) Deviant stimuli evoked greater theta power compared to standard stimuli and standard stimuli under the stress state triggered greater theta power.