Figures & data
Table 1 Clinical Characteristics of Control Group and MDD Group
Table 2 Comparison of Serum Cytokines Between Control Group and MDD Group
Figure 1 Serum levels of different CC chemokines in control group and MDD group. (A) Comparison of MCP-1; (B) Comparison of MIP-1α; (C) Comparison of MIP-1β; (D) Comparison of MCP-4; (E) Comparison of TARC; (F) Comparison of MDC; (G) Comparison of Eotaxin-3. The data are presented as the mean ± SEM. *P < 0.05, **P < 0.01.
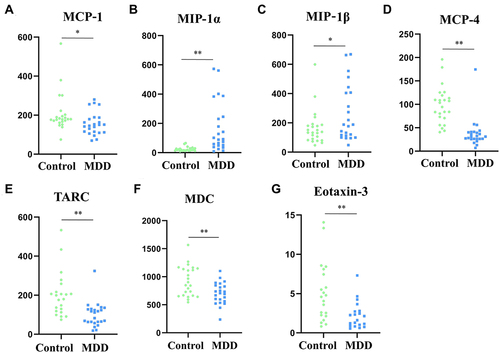
Table 3 ROC Analysis of Different Cytokines in Discriminating Patients with MDD from Healthy Volunteers
Figure 2 ROC curves of different CC chemokines in identification of patients with MDD from healthy volunteers. (A) ROC curve of MCP-1; (B) ROC curve of MIP-1α; (C) ROC curve of MIP-1β; (D) ROC curve of MCP-4; (E) ROC curve of TARC; (F) ROC curve of MDC; (G) ROC curve of Eotaxin-3.
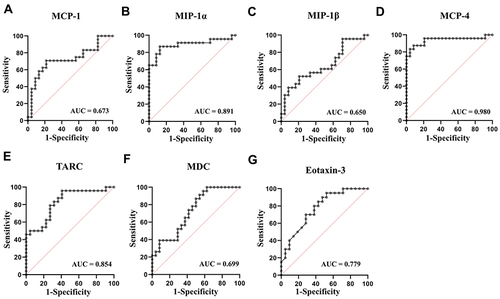
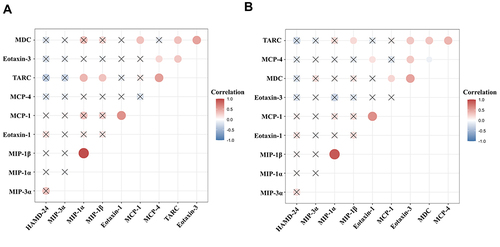
Figure 3 Correlation between HAMD-24 scores and the levels of CC chemokines in MDD group. (A) Correlation between HAMD-24 scores and the levels of CC chemokines (original data); (B) Correlation between HAMD-24 scores and the levels of CC chemokines (log2 transformed). ×: no significance.