Figures & data
Figure 1 Results of ANOVA with “type of behavioral ethics” and “stages of firm development” are independent variables.
Notes: The asterisks represent significant differences (*p < 0.05) between two corresponding conditions; the error bars represent one SEM; and the absent label between two conditions means non-significant difference.
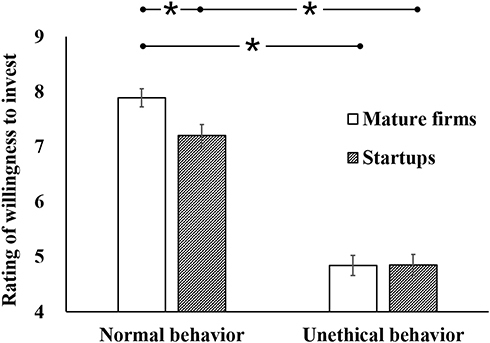
Figure 2 Results of ANOVA with “targets involved in the events” as the independent variable.
Notes: The asterisks represent significant differences (*p < 0.05) between two corresponding conditions; the error bars represent one SEM; and the absent label between two conditions means non-significant difference.
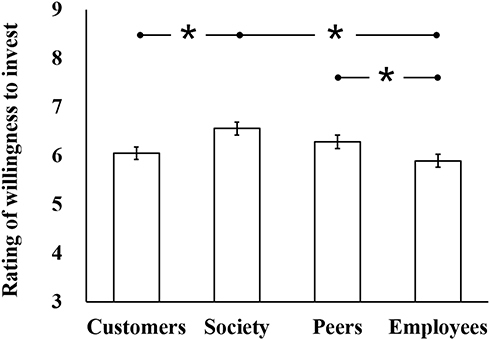
Figure 3 Results of simple effects analysis with “targets involved in the events” as the independent variable on the grouped data under both normal and unethical behavior conditions.
Notes: The asterisks represent significant differences (*p < 0.05) between two corresponding conditions; the error bars represent one SEM; and the absent label between two conditions means non-significant difference.
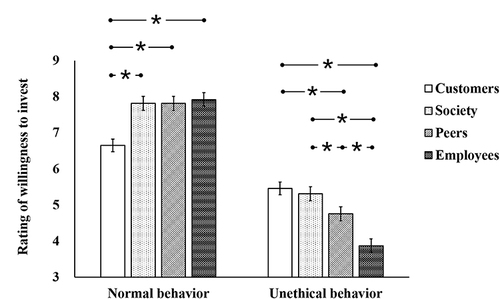
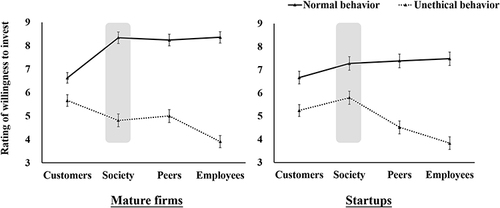
Figure 4 Results of simple effects analyses on the grouped data under both mature firms (left line chart) and startups (right line chart) conditions.
Notes: The highlight marks in grey represent that the interaction effect with “type of behavioral ethics” and “stages of firm development” as the independent variables was significant only under the society condition.