Figures & data
Table 1 Comparison of Selected Clinical and Psychological Variables in Relation to Allelic Variants in the 5-HTTLPR Gene Polymorphism
Table 2 The Comparison of the Intensity of Alcohol Craving During 4 Weeks of Hospitalisation of Alcohol-Dependent Patients and the Gene Polymorphisms (2A). The Changes of the Intensity Alcohol Craving Between the First and Second Study According Gene Polymorphism – Detailed Analysis (2B)
Figure 1 Shows the percentages of people with mild, moderate and severe alcohol craving (according to the PACS scale) divided into three subgroups with respect to the 5-HTTLPR polymorphism. 1 Measurement of severity of alcohol craving at the start of treatment (in the first 2 weeks of hospitalisation); 2- measuring the severity of alcohol craving 4 weeks after the first examination. Illustration of the percentage incidence of PACS results in the three subgroups by descriptive statistics - no statistical tests were used here.
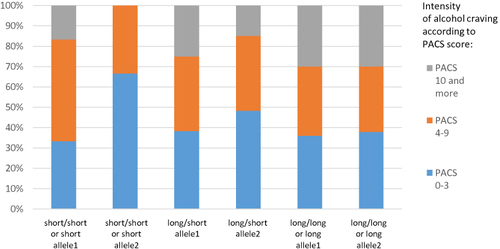
Table 3 An Attempt to Assess Whether, in Addition to the 5-HTTLPR Gene Polymorphism, Other Factors Were Associated with Changes in the Severity of Alcohol Craving (3A) and the Model of the Intercorrelation of These Variables (3B)
Figure 2 Alcohol craving severity scores (PACS scale scores) in depending on the type of polymorphism of the 5-HTTLPR gene (“0” - subjects with the short/short or short alleles; “1” - individuals with alleles of short/long; “2”- subjects with long/long or long alleles) in alcohol-dependent patients tested (improvement means low alcohol craving severity scores; the decrease in PACS scores obtained by the subjects after 4 weeks of treatment compared to the first test of severity of alcohol craving with the PACS scale is presented as an improvement; the decrease in scores is included as a percentage of the decrease in relation to the original PACS values and compared between patient groups. 5-HTTLPR polymorphism; Expected marginal averages. Current effect: F (2, 127)=2.9747, p=0.05463. Decomposition of effective hypotheses. Vertical bars indicate 0.95 confidence intervals.
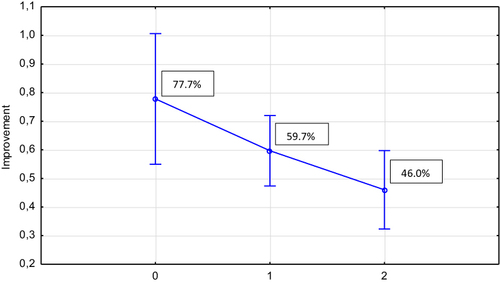
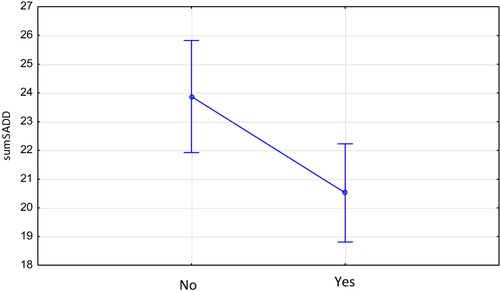
Figure 3 Alcohol craving severity scores (PACS scale score) in relation to severity of alcohol dependence (SADD scale score) in surveyed alcohol-dependent patients (improvement indicates low alcohol craving severity scores). Improvement; Expected marginal averages. Current effect F (1, 127)=6.5383, p=0.01173. Decomposition of effective hypotheses. Vertical bars indicate 0.95 confidence intervals. Improvement (Yes) - is a decrease in PACS value. No improvement (No) - no decrease or increase in PACS value.