
Figures & data
Table 1 Demographic Data of the Respondents (N=181)
Table 2 Means, Standard Deviations, and Intercorrelations of Study Variables (N=181)
Table 3 Distribution of Intern Nursing Students’ Levels of SAS, PSS-14, CDMNS and Personality Traits According to Personal Characteristics (N=181)
Table 4 Regression Analysis (the Impact of Personality Traits on PSS-14) (N = 181)
Table 5 Regression Analysis (the Impact of Personality Traits on SAS) (N = 181)
Table 6 Regression Analysis (the Impact of Personality Traits on CDMNS) (N = 181)
Figure 1 The Relationship Between the Respective Variables and the Dependent Variable.
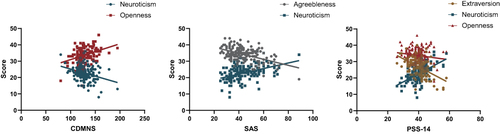
Table 7 The Levels of Participants’ Anxiety and Stress (N=181)