Figures & data
Figure 1 Experimental design.
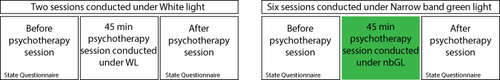
Table 1 A Summary of All 13 Patients’ Improved Responses to All 20 Questions Before and After the 2 Sessions in WL and 6 Sessions in the nbGL
Figure 2 Analysis of participants’ responses to all 20 items in the State-Trait Anxiety Inventory (STAI Form Y-1). Histograms illustrate the score each item received before (gray bar) and after psychotherapy sessions conducted under white light (white bars) and narrow band green light (green bars). Answers to positively worded questions are shown on the left, and answers to negatively worded questions are shown on the right. Positively worded questions included: 1. I feel calm, 2. I feel secure, 3. I feel at ease, 4. I feel satisfied, 5. I feel comfortable, 6. I feel self-confident, 7. I am relaxed, 8. I feel content, 9. I feel steady, 10. I feel pleasant. Negatively worded questions included: 1. I am tense, 2. I feel strained, 3. I feel upset, 4. I am presently worrying over possible misfortunes, 5. I feel frightened, 6. I feel nervous, 7. I am jittery, 8. I feel indecisive, 9. I am worried, 10. I feel confused. Each question was scored as follows: 1 - not at all, 2 - somewhat, 3 - moderately so, 4 = very much so. Line plots illustrate mean ± SD of scores each subject provided for all 10 positively worded and all 10 negatively worded items before and after the 2 sessions in white light and 6 sessions in nbGL. (A) Example of a patient in which improvement in psychotherapy sessions conducted under nbGL was shown by the answers to both positive and negative questions (circled). (B) Example of a patient in which improvement under nbGL was shown by the answers to the positive (circled) but not negative questions. (C) Example of a patient in which improvement under nbGL was shown by the answers to the negative (circled) but not positive questions. (D) Example of a patient in which responses to positive or negative questions reflected no improvement under nbGL.
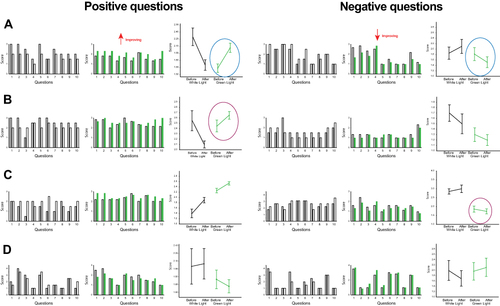
Figure 3 Item-by-item analysis: (A) Analysis of the frequency of positive items showing improvement under WL (white bars) as compared to nbGL (green bars) conditions. (B) Analysis of the frequency of negative items showing improvement under WL (white bars) as compared to nbGL (green bars) conditions. Asterisks depict items where improvement under nbGL was >50% higher than under WL.
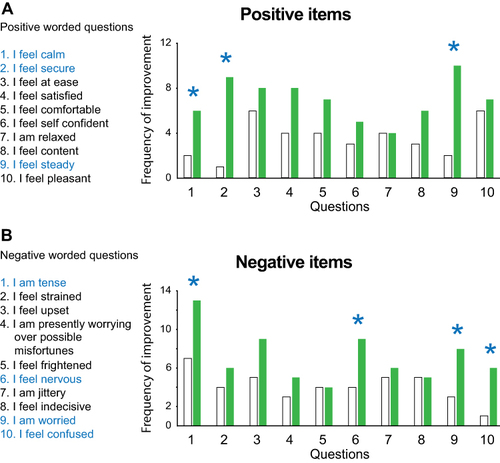
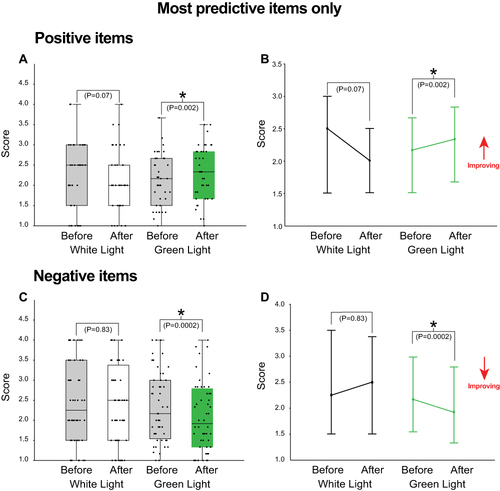
Figure 4 Effectiveness of psychotherapy under nbGL vs WL. (A) Analysis of the 3 most predictive positively worded items. In the scatograms, each of the 39 dots represents the average of the scores given by each of the 13 patients to each item before and after exposure to white (average of 2 sessions) and nbGL (average of 6 sessions) lights. The Boxplots show median and IQR. (C) Analysis of the 4 most predictive negatively worded items. In the scatograms, each of the 52 dots represents the average of the scores given by each of the 13 patients to each item before and after exposure to white (average of 2 sessions) and nbGL (average of 6 sessions) lights. The Boxplots show median and IQR. (B and D) Line plots of median and IQR show direction of improvement. Asterisks depict significant difference p<0.05 Wilcoxon signed rank test.