Figures & data
Figure 1 PRISMA flow diagram.
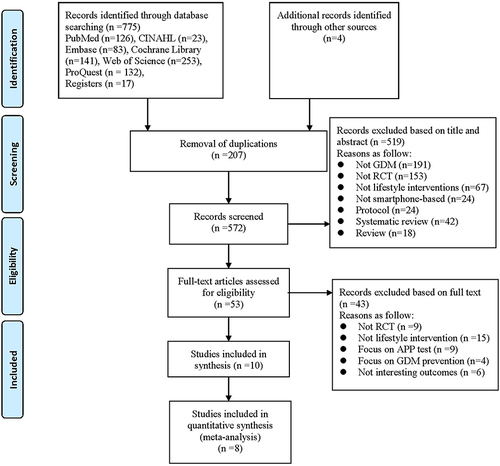
Table 1 Characteristics of Included Studies
Table 2 Content of Lifestyle Interventions of Included Studies
Table 3 Outcome Measures Available for Meta-Analysis
Table 4 Summary of Quality Assessment of Studies by the Cochrane Risk-of-Bias Tool (RoB 2)
Figure 2 Forest plot of compliance.
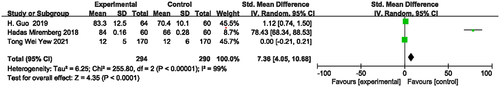
Figure 3 Forest plot of HbA1C.
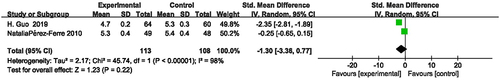
Figure 4 Forest plot of gestational weight gain.
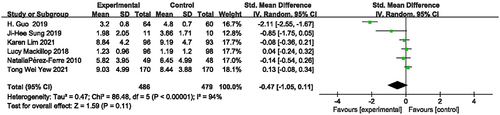
Figure 5 Forest plot of gestational age at delivery.
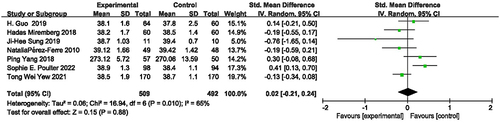
Figure 6 Forest plot of normal vaginal delivery.
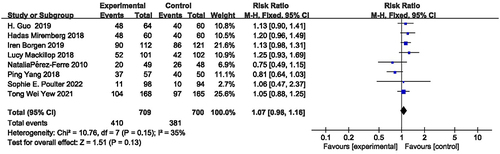
Figure 7 Forest plot of cesarean delivery.
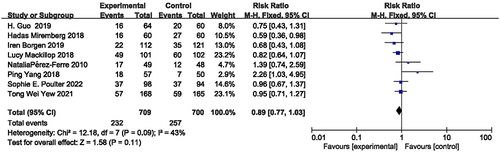
Figure 8 Forest plot of Infant birth weight.
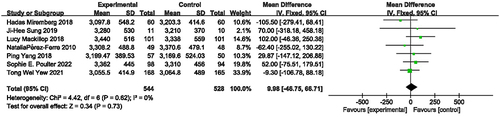
Figure 9 Forest plot of neonatal hypoglycemia.
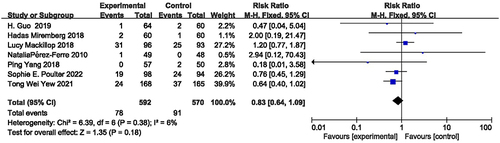
Table 5 Effect Sizes for Primary and Secondary Outcomes from RCTs
Figure 10 Forest plot of NICU admission.
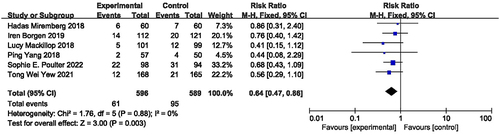
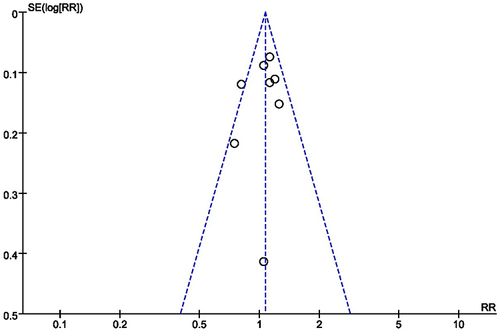
Figure 11 Funnel plot.