
Figures & data
Figure 1 Conceptual model.
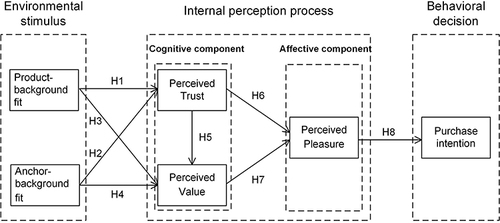
Table 1 Descriptive Statistics of Survey Respondents (N = 424)
Table 2 KMO and Bartlett Test
Table 3 Measurement Model
Table 4 Discriminant Validity
Table 5 Strength of the Model
Table 6 The F² Values
Figure 2 Result of the structural equation model (**p<0.01, ***p<0.001).
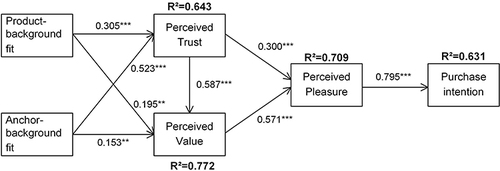
Table 7 Results of Path and Hypothesis Testing