Figures & data
Figure 1 Brief descriptions of cognitive training tasks.
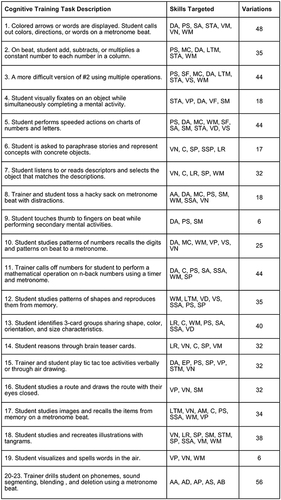
Figure 2 Example of a memory training task.
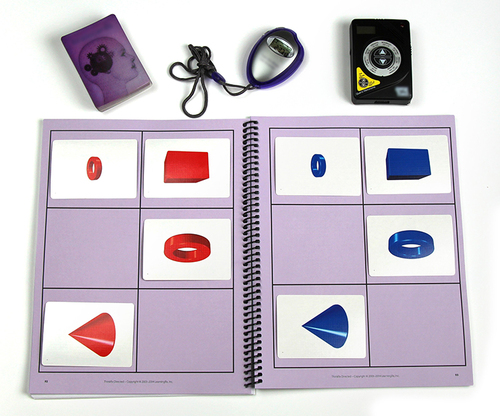
Figure 3 Example of a complex code training task.

Table 1 Paired Samples t-tests for Cognitive and Reading Outcome Measures in Standard Scores
Table 2 Age-Equivalent Change in Reading Skills
Table 3 Predictors of Change in Phonological Awareness Scores
Table 4 Predictors of Change in Word Attack Scores
Table 5 Predictors of Change in Spelling Scores
Table 6 Predictors of Change in Phonetic Coding Scores
Table 7 Predictors of Change in Comprehension Scores
Table 8 Qualitative Themes and Subthemes
Figure 4 Percentage of students with and without ADHD reporting improvements in each qualitative theme.
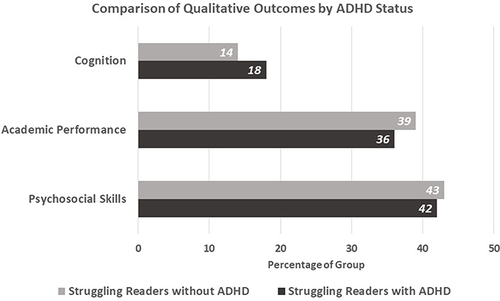
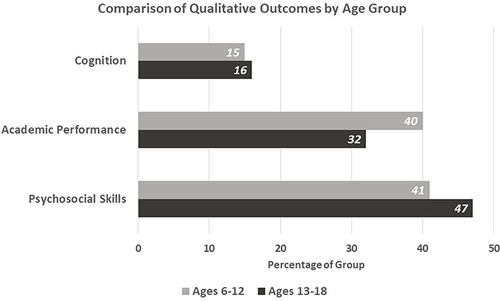
Figure 5 Percentage of each age group reporting improvements in each qualitative theme.