Figures & data
Figure 1 Research model.
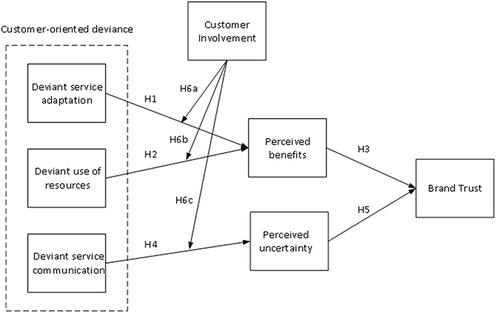
Table 1 Reliability Test and Validity Analysis of Variables
Table 2 Demographic Characteristics of the Sample (N=468)
Table 3 Results of Discriminant Validity of Variables
Table 4 Basic Path Test of the Model
Table 5 Bootstrap Analysis of the Intermediate Effects Test (Standardized Coefficients)
Table 6 Moderated Model Tests for Customer Involvement
Table 7 Direct Effects at Different Levels of Customer Involvement
Figure 2 The moderating role of customer involvement in deviant service adaptation and perceived benefits.
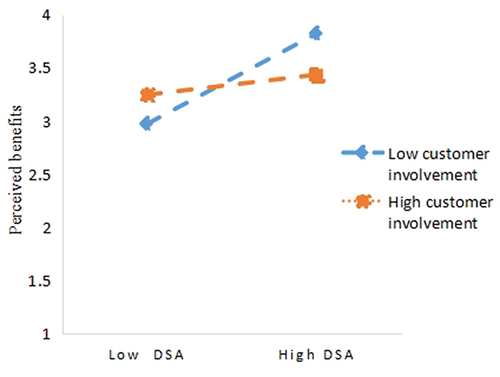
Figure 3 The moderating role of customer involvement in deviant use of resources and perceived benefits.
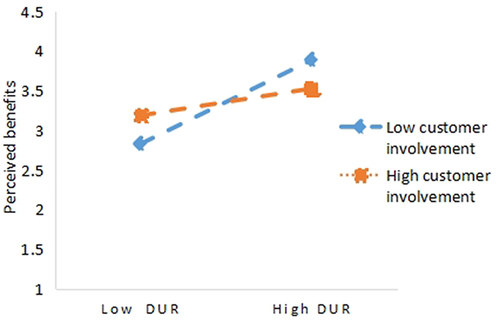
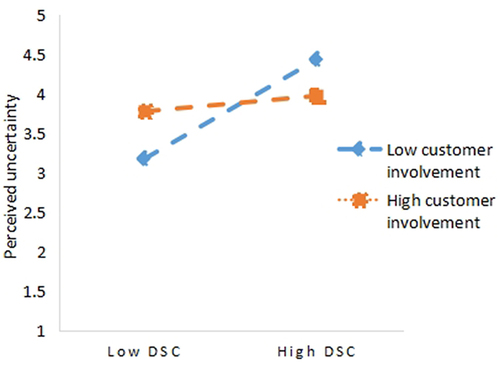
Figure 4 The moderating role of customer involvement in deviant service communication and perceived uncertainty.