
Figures & data
Figure 1 Componential Model of Creativity.
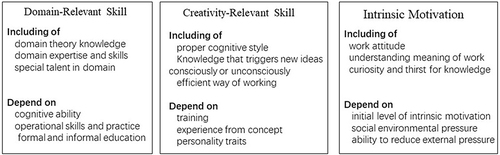
Table 1 Rotated Component Matrix of Pre-PRIAS
Table 2 Item Analysis
Table 3 Rotated Component Matrix of PRIAS
Figure 2 Scree plot of exploratory factor analysis.
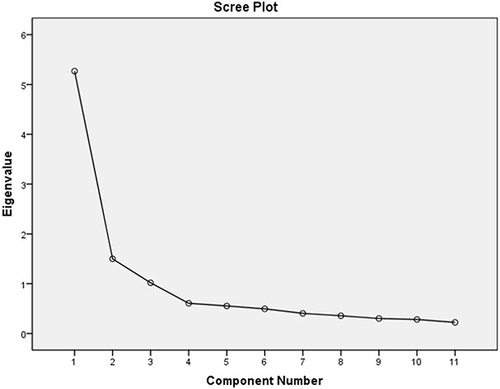
Figure 3 Measurement model fit of Postgraduate Research Innovation Ability Scale.
Notes: Factor 1 = creativity-relevant process; Factor 2 = domain-relevant skills; Factor 3 = intrinsic motivation.
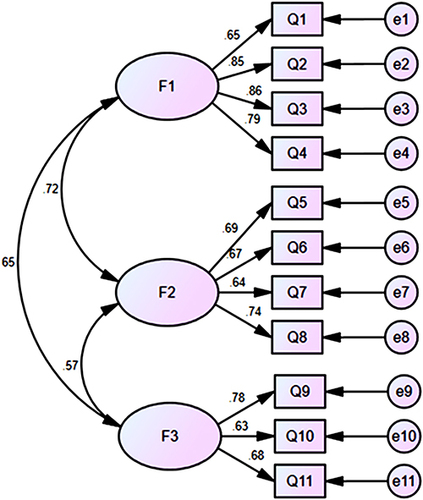
Table 4 Pearson Correlations Among the Variables (N = 164)
Box 1 Items of the Scale