
Figures & data
Table 1 Demographic Characteristics of the Study Participants (n = 1241)
Table 2 Assessment of Students’ Anxiety (n = 1241) Using the Hospital Anxiety and Depression Scale (HADS)
Table 3 Assessment of Students’ Depression (n = 1241) Using the Hospital Anxiety and Depression Scale (HADS)
Figure 1 Interpretation of students’ (n = 1241) proportions of those with normal vs borderline abnormal vs abnormal symptoms using the Hospital Anxiety and Depression Scale (HADS).
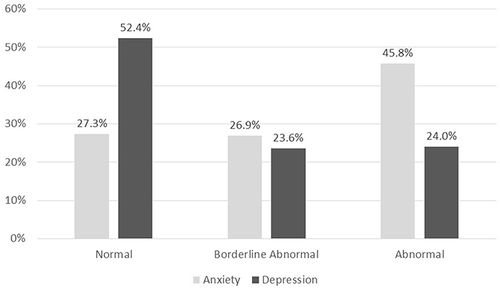
Figure 2 Comparing the anxiety and depression mean scores of male (n = 494, 39.8%) and female (n= 747, 60.2%) participant students.
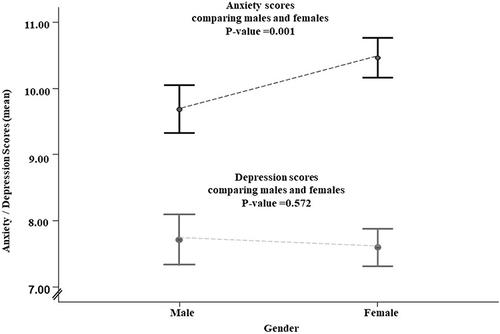
Table 4 Assessment of Factors Affecting Anxiety Scores Among the Study Participants (n = 1241)
Table 5 Assessment of Factors Affecting Depression Scores Among the Study Participants (n = 1241)