
Figures & data
Table 1 Product Attribute Specifications in the Product Choice Task
Figure 1 An illustration of a single trial in the product choice task. Each trial consisted of fixation, product name, a black screen and decision-making. After fixation appeared, the product name was presented for 1000ms. Then, the black screen was randomly displayed for 600–800ms. Subsequently, participants were instructed to make choices between buying green (eco-friendly) products or cheaper (self-interest) common products in green consumption decision-making, which was presented for 5000ms. Finally, the black screen was displayed for 1000ms.
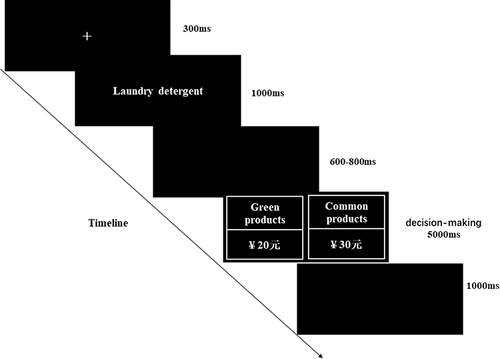
Table 2 Descriptive Statistics and Results of Planned Contrasts
Table 3 The Proportion of Green Products Purchase at Different Personal Costs
Figure 2 The proportion of green products purchase in different situations. **p < 0.01, ***p < 0.001.
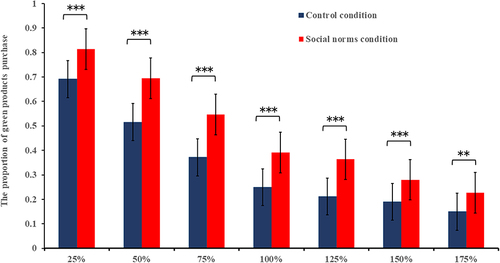
Table 4 Results of Mediating Analysis of Personal Norms at Different Personal Costs