Figures & data
Figure 1 Schematic diagram of psychological resilience recombination results.
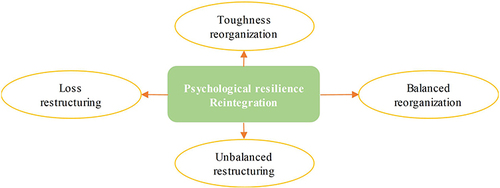
Figure 2 Schematic diagram of the psychological resilience framework.
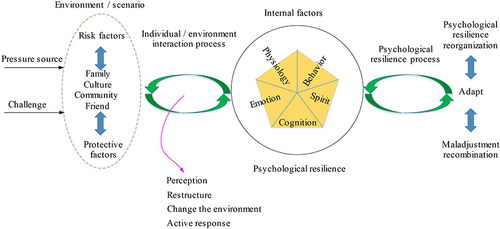
Figure 3 Diagram of social support networks for older persons in a healthy community.
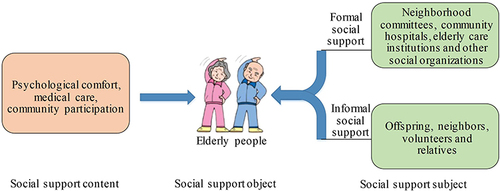
Table 1 Cronbach’s Alpha Test Results for Questionnaire Results
Table 2 Descriptive Statistics
Figure 4 The score differences of each dimension of subjective well-being in health status (***p < 0.001, **p < 0.01, and *p < 0.05).
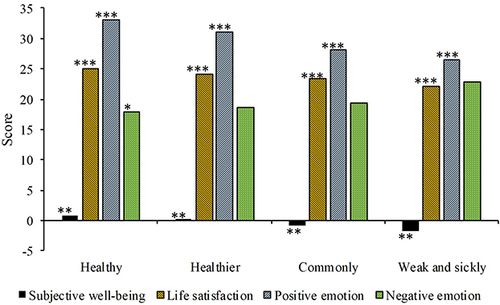
Figure 5 The results of the differences in the scores of social support, optimism, and psychological resilience in health status (***p < 0.001, **p < 0.01, and *p < 0.05).
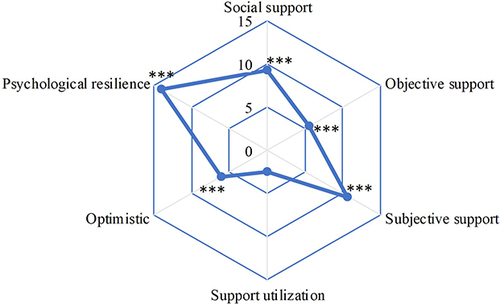
Figure 6 Correlation analysis results of elderly subjective well-being with social support, optimism, and psychological resilience (*** p < 0.001).
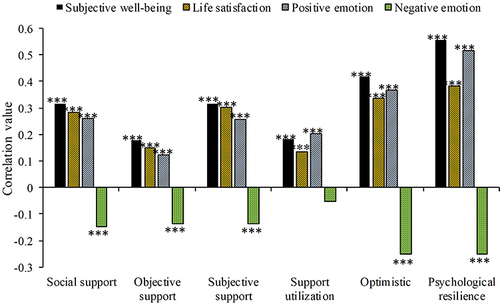
Figure 7 Correlation analysis results of elderly social support with optimism and psychological resilience (*** p < 0.001).
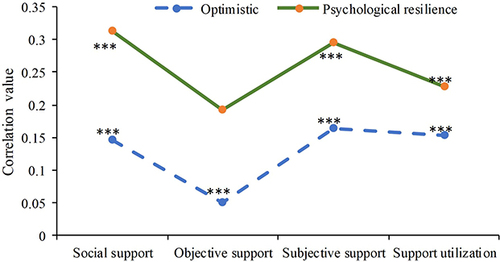
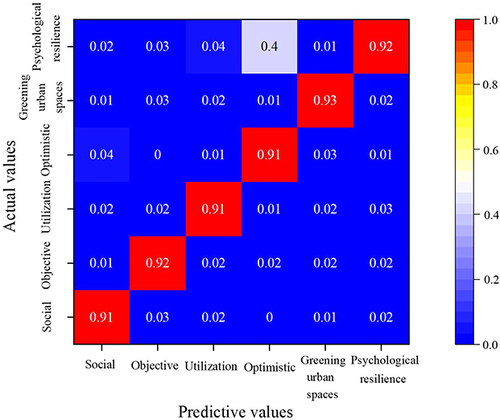
Figure 8 Classification confusion matrix using an ML algorithm.