
Figures & data
Figure 1 The sequence of events in the carbon emissions for monetary rewards task.
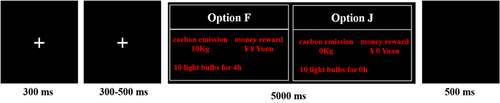
Figure 2 Experimental procedures of Study 1.
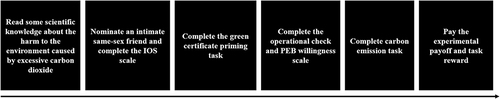
Table 1 Results of Priming Checks, Willingness, and PEB in Study 1 (M ± SD)
Figure 3 Proportions of carbon emission and green purchasing choices in Study 1–4. (A) Is the carbon emission in Study 1; (B) Is the carbon emission in Study 2; (C) Is the green purchasing in Study 3; (C and D) Are the carbon emission and green purchasing in Study 4.
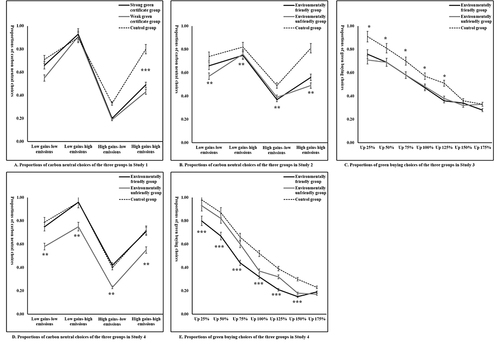
Table 2 Results of Priming Checks, Willingness, and PEB in Study 2 (M ± SD)
Figure 4 The sequence of events in the green purchasing task of Study 3.
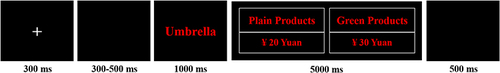
Table 3 Results of Priming Checks, Willingness, and PEB in Study 3 (M ± SD)
Table 4 Results of Priming Checks, Willingness, and Behaviors of PEB in Study 4 (M ± SD)