Figures & data
Figure 1 Hypothesized moderated mediation model.
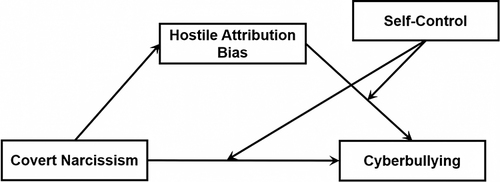
Table 1 Descriptive Statistics of the Demographic Variables
Table 2 Demographic Difference Analysis
Table 3 Means, Standard Deviations, and Correlations of the Main Variables (N=672)
Table 4 Testing the Mediating Effect of Hostile Attribution Bias on Cyberbullying
Figure 2 Mediation model. c is the total effect of covert narcissism on cyberbullying, a is the effect of covert narcissism on hostile attribution bias, b is the effect of hostile attribution bias on cyberbullying and c’ is the direct effect of covert narcissism on cyberbullying. ***p<0.001.
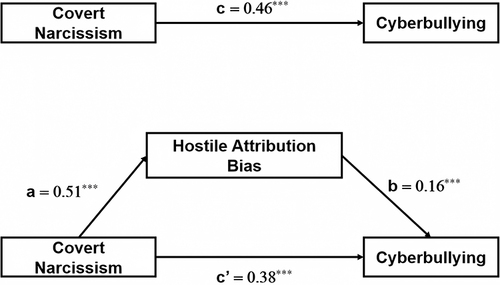
Table 5 Testing the Moderated Mediation Effect of Self-Control of Covert Narcissism on Cyberbullying
Figure 3 The final model of this study. *p<0.05; ***p<0.001.
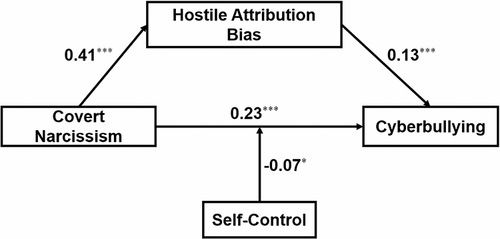
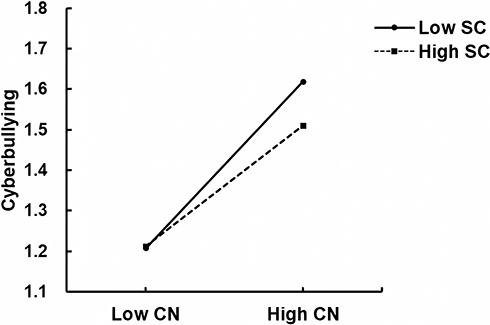
Figure 4 Moderating effect of self-control on the relationship between covert narcissism and cyberbullying.