Figures & data
Table 1 Fit Index of the Latent Profile Models of Statistical Anxiety in University Students (n = 1607)
Table 2 Descriptive Statistics of Three Latent Classes of University Students for Each Dimension of Statistical Anxiety (n = 1607)
Figure 1 Line graph of the mean values of the three latent classes of university students for each dimension of statistical anxiety.
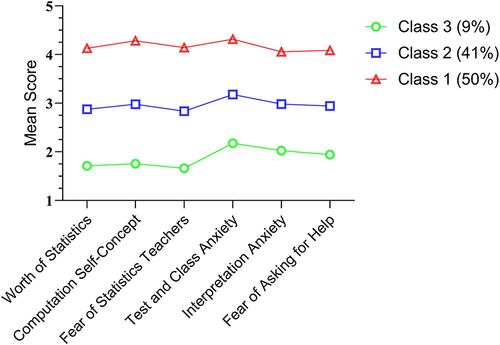
Table 3 Correlation Analysis of Variables Related to Statistical Anxiety and the Learning Performance of University Students in Different Latent Classes
Figure 2 Overall network structure of the statistical anxiety of university students with mild test anxiety.
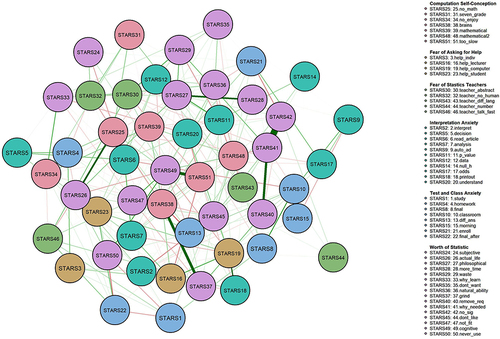
Figure 3 Overall network structure of the statistical anxiety of university students with moderate test anxiety.
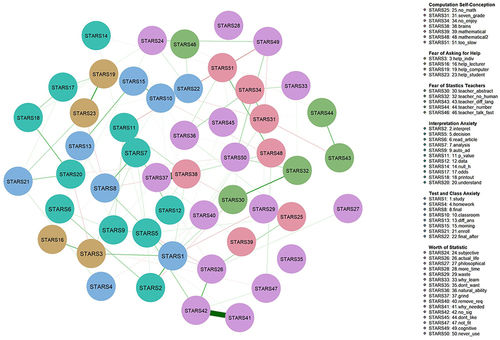
Figure 4 Overall network structure of the statistical anxiety of university students with severe statistical anxiety.
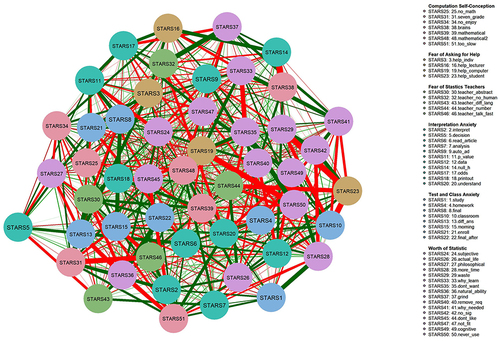
Table 4 Top Five Items for the Three Anxiety Network Structural Centrality Analysis Indicators
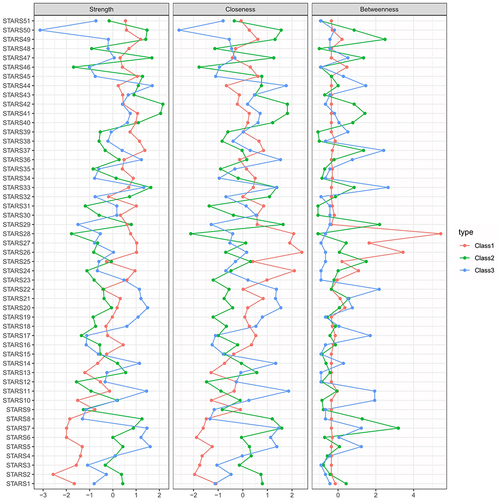
Figure 5 Summary of the structural centrality analysis indicators for the three anxiety networks.