Figures & data
Table 1 Comparisons of PPCBI, BID, EDs, BMI and Age Between Genders ()
Table 2 Correlation Coefficients Between PPCBI, BID, EDs and BMI
Table 3 The Results of Multiple Linear Regression of Association Among PPCBI, BMI, BID and EDs Among Children and Adolescent at Different Development Stages
Figure 1 Preliminary association pathways among PPCBI, BMI, Bid, EDs.
Abbreviations: PPCBI, parental pressure on children’s body image; BMI, body mass index; BID, body image dissatisfaction; EDs, eating disorders.
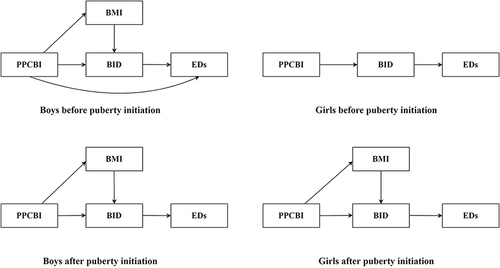
Table 4 Pathways Model Fitting Indices Recommended Indexes
Table 5 Indirect Coefficients of Association Pathways Among PPCBI, BMI, BID, EDs in Children and Adolescents at Different Development Stages
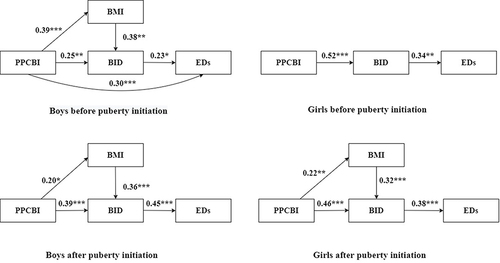
Figure 2 Fitting of association pathways among PPCBI, BMI, Bid, EDs.
Notes: *P<0.05, **P<0.01, ***P<0.001.
Abbreviations: PPCBI, parental pressure on children’s body image; BMI, body mass index; BID, body image dissatisfaction; EDs, eating disorders.