
Figures & data
Figure 1 Schematic illustration of the sequentially displayed stimuli of one trial. Between the two dashed lines is the masking phase of the prime stimuli. The prime stimuli were subliminally shown following the display of the target, with a duration of 1s. The procedures for the two experiments were the same except for differences in the priming phase involving the presentation of the prime stimuli, as shown in .
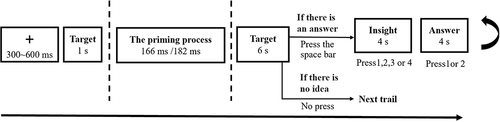
Figure 2 The specific presentation of stimuli during the priming phase differed between Experiment 1 and Experiment 2. In Experiment 1, two stimuli were presented simultaneously, while in Experiment 2, two stimuli were presented sequentially with a duration of 16 ms each.
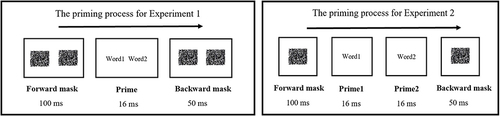
Table 1 Means and Standard Error of Accuracy (%) for All the Conditions in Experiment 1
Figure 3 Means of accuracy (%) for each Condition of Prime condition and RAT difficulty in Experiment 1. The error bars represent one standard error of the mean.
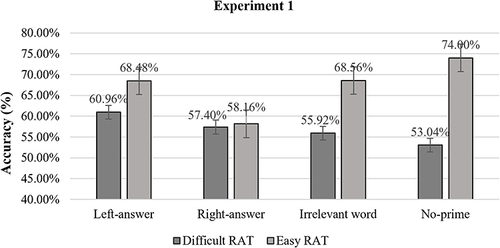
Table 2 Means and Standard Error of Reaction Times (Ms) for All the Conditions in Experiment 1
Table 3 Means and Standard Error of Insight for All the Conditions in Experiment 1
Table 4 Means and Standard Error of Accuracy (%) for All the Conditions in Experiment 2
Figure 4 Means of accuracy (%) for each condition of prime condition and RAT difficulty in Experiment 2. The error bar represents one standard error of the mean.
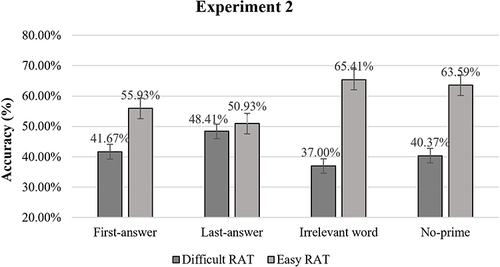
Table 5 Means and Standard Error of Reaction Times (Ms) for All the Conditions in Experiment 2
Figure 5 Means of reaction times (ms) for each condition of prime condition and RAT difficulty in Experiment 2. The error bar represents one standard error of the mean.
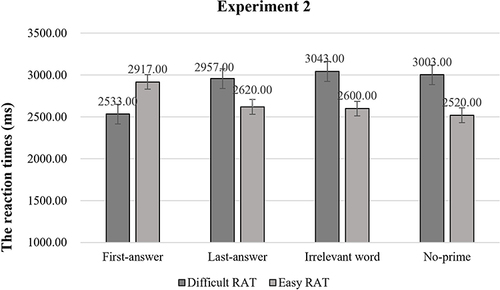
Table 6 Means and Standard Error of Insight for All the Conditions in Experiment 2