Figures & data
Table 1 Search String
Figure 1 PRISMA flow diagram.
Notes: PRISMA figure adapted from Page MJ, McKenzie JE, Bossuyt PM, et al. The PRISMA 2020 statement: an updated guideline for reporting systematic reviews. BMJ. 2021;372:n71. Creative Commons.Citation35
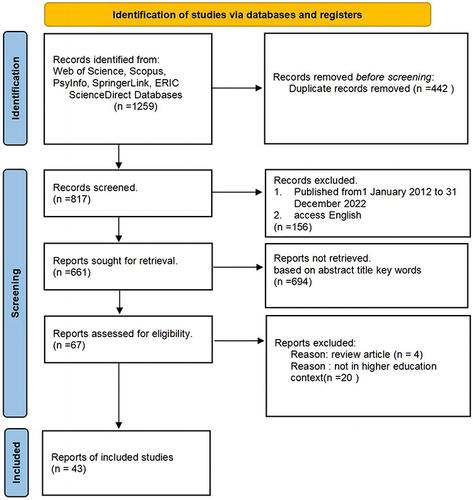
Table 2 The Characteristics and CCAT Scores of the 43 Studies
Figure 2 Publications arranged by publication year.
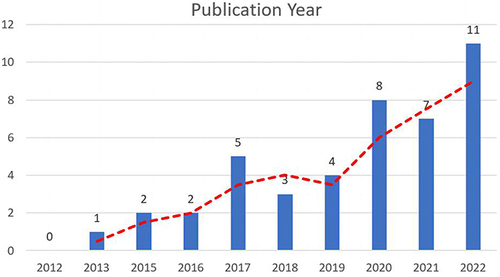
Figure 3 Geographical distribution of journal articles.
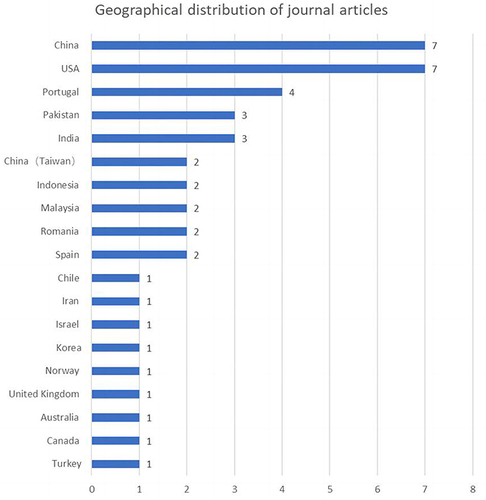
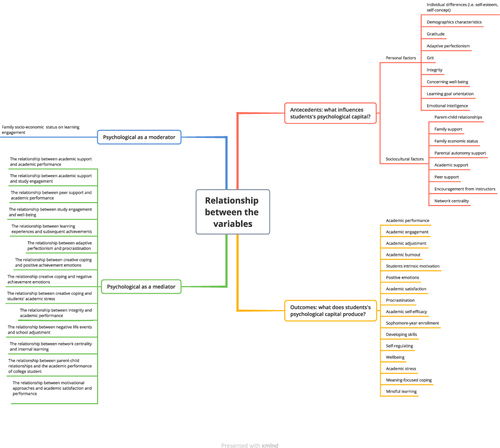
Figure 4 Key themes and subthemes in the literature on psychological capital related to academic outcomes among university students.