Figures & data
Table 1 Descriptive Statistics of the Six-Item De Jong Gierveld Loneliness Scale (n=8472)
Figure 1 Network structure of loneliness symptoms in Chinese residents. The upper panel provides a visualization of the network structure, while the lower panel displays the values of strength in order. In the upper panel, edge thickness indicates the strength of the association, while green and red edges represent positive and negative associations. Light blue nodes and golden yellow nodes represent social and emotional loneliness communities, respectively.
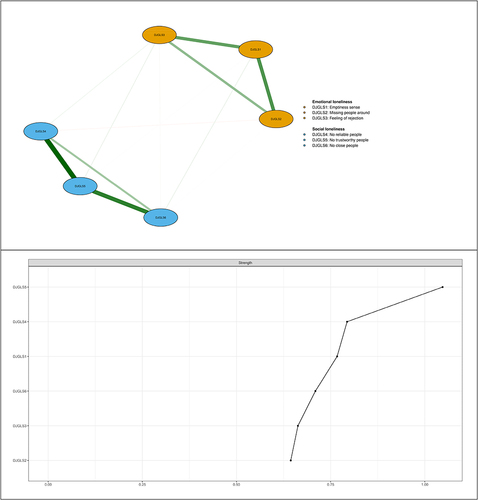
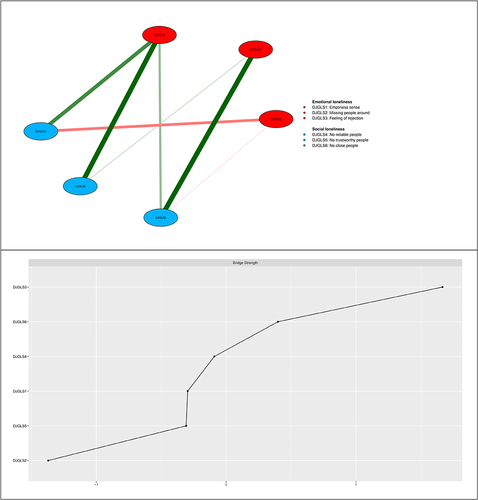
Figure 2 Network structure of social and emotional loneliness symptoms showing bridge symptoms in Chinese residents. The upper panel presents a visualization of the network structure depicting the bridging symptoms, while the lower panel displays the corresponding bridge strength values in order. In the upper panel, edge thickness indicates the strength of the association, while green and red edges represent positive and negative associations. Light blue nodes and red nodes represent social and emotional loneliness communities, respectively.