
Figures & data
Table 1 Discriminant Validity and Common Method Bias Tests
Table 2 Means, Standard Deviations and Correlations
Figure 1 The path analysis results of model.
Notes: The path coefficients in the figure are non-standardized coefficients. This model includes control variables (omitted). ***p<0.001, **p<0.01.
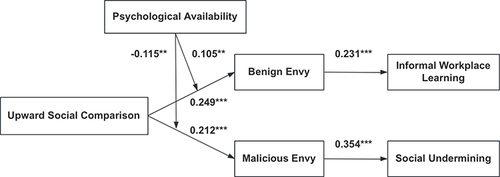
Figure 2 The interaction between upward social comparison and psychological availability on benign envy.
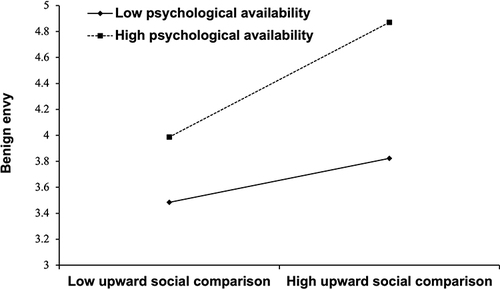
Figure 3 The interaction between upward social comparison and psychological availability on malicious envy.
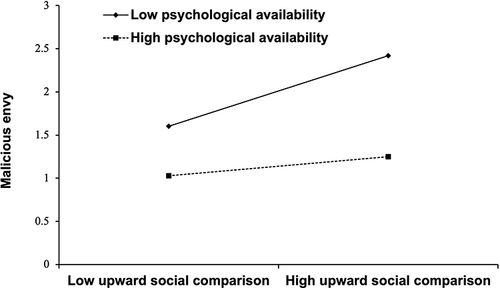
Table 3 Results of Moderated Mediation Effect