Figures & data
Table 1 Matrix of Means, Standard Deviations and Correlation Coefficients of Each Variable
Figure 1 Nonlinear unconditional latent growth model for problematic internet use.
Note: T1–T4 for grades 6–9, respectively; *p<0.05, **p<0.01, ***p<0.001.
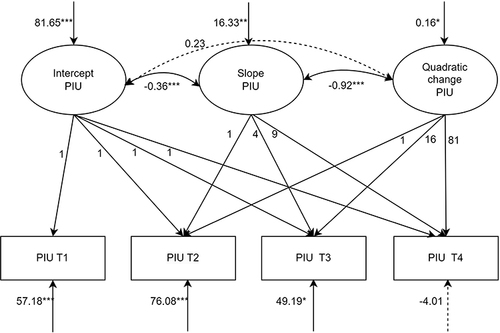
Figure 2 Gender differences in the developmental trajectory of problematic internet use.
Note: T1–T4 for grades 6–9, respectively; *p<0.05, **p<0.01, ***p<0.001.
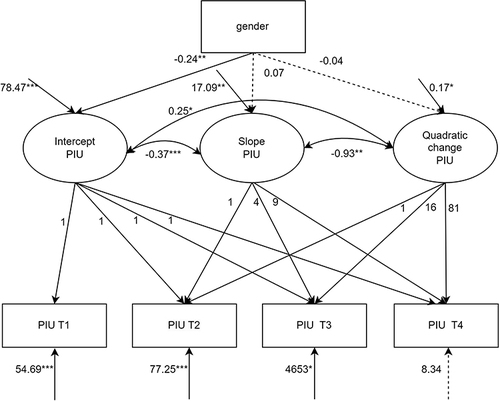
Figure 3 The effect of gender difference and loneliness on the developmental trajectory of problematic internet use.
Note: T1–T4 for grades 6–9, respectively; *p<0.05, **p<0.01, ***p<0.001.
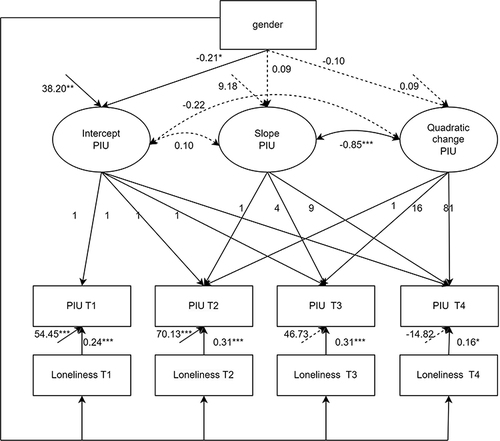
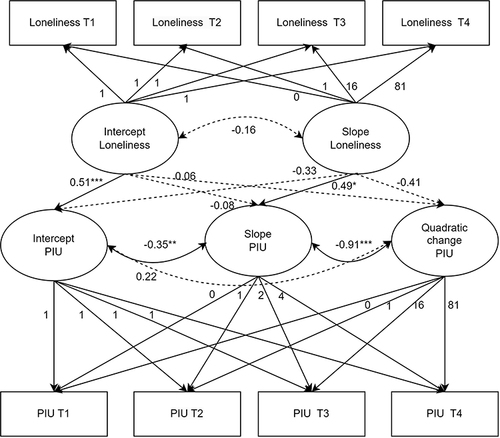
Figure 4 Latent variable growth model for the parallel development process.
Note: T1–T4 for grades 6–9, respectively; *p<0.05, **p<0.01, ***p<0.001.