
Figures & data
Table 1 Descriptive Statistics for the Main Variables and Covariates
Table 2 Model Fitting Indices Based on Three Samples
Table 3 Bootstrap Confidence Intervals and Effect Sizes of the Direct and Indirect Effects
Figure 1 Mediation model of the path from early parental conflict to depression among older adults.
Note: ***p < 0.001.
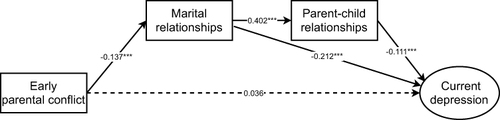
Figure 2 Mediation model of the path from early parental conflict to depression among older males.
Note: *p < 0.05, **p < 0.01, ***p < 0.001.
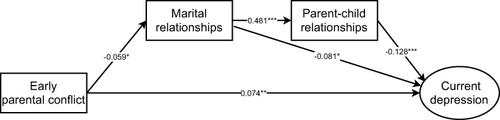
Figure 3 Mediation model of the path from early parental conflict to depression among older females.
Note: ***p < 0.001.
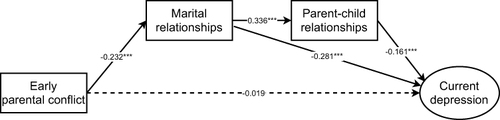
Table 4 Fitting Indices of the Multiple-Group Analysis Model
Table 5 Critical Ratios of Path Coefficients in the Multiple-Group Analysis Model