
Figures & data
Table 1 Descriptive Statistical Results of the Two Groups
Figure 1 (A and B) Correlation analysis. (A) Negative correlation between cognitive reappraisal and anger in the long-term group. (B) Negative correlation between cognitive reappraisal and depression in the long-term group.
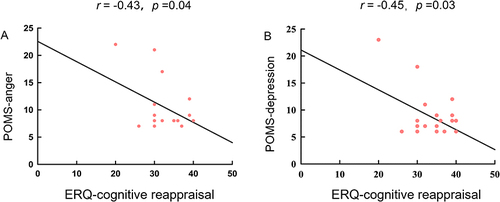
Figure 2 (A and B) Frontal lobe lateralization in two groups. (A) Frontal lobe lateralization at three sets of electrode sites (Fp1/Fp2, F3/F4, F7/F8) in the long-term group between pre-test and post-test (B) Frontal lobe lateralization at three sets of electrode sites (Fp1/Fp2, F3/F4, F7/F8) in the short-term group between pre-test and post-test *p < 0.05.
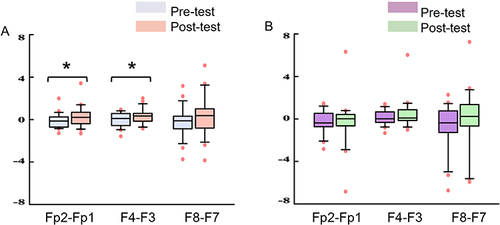
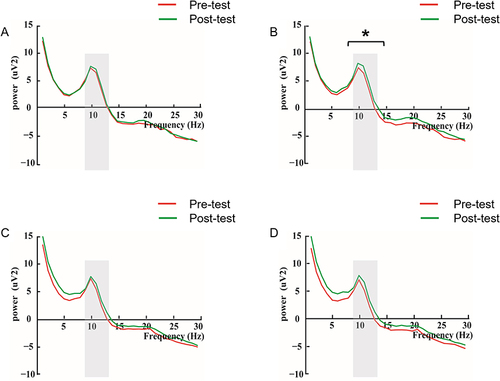
Figure 3 (A–D) Mean PSD in the left and right frontal lobe of the two groups. (A) Pre- and post-test differences in the mean PSD of the three electrode sites in the left frontal lobe (Fp1, F3, F7) in the long-term group (B) Pre- and post-test differences in the mean PSD of the three electrode sites in the right frontal lobe (Fp2, F4, F8) in the long-term group (C) Pre- and post-test differences in the mean PSD of the three electrode sites in the left frontal lobe (Fp1, F3, F7) in the short-term group (D) Pre- and post-test differences in the mean PSD of the three electrode sites in the right frontal lobe (Fp2, F4, F8) in the short-term group *p < 0.05.
Data Sharing Statement
The data can be obtained by contacting the corresponding author for reasonable requests.