
Figures & data
Figure 1 Conceptual framework and hypothesis.
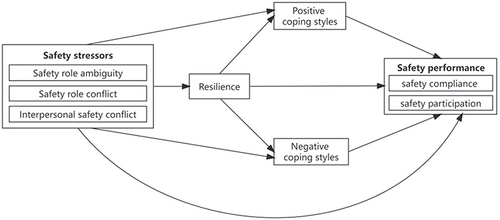
Table 1 Demographic Characteristics of the Respondents (N=364)
Table 2 Results of Reliability and Validity Testing
Table 3 Means, SD, and Correlation Coefficients Among Variables
Table 4 Results of the Regression Analysis
Table 5 Total, Direct, and Indirect Effects of Safety Stressors on Safety Performance
Figure 2 Mediating roles of resilience and coping styles affect between SRA and SC. ***P < 0.001.
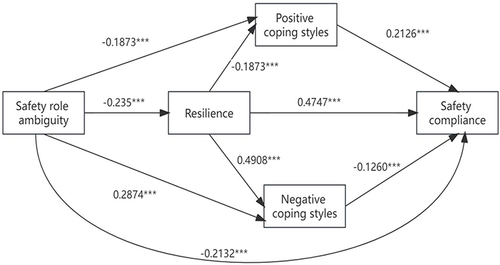
Figure 3 Mediating roles of resilience and coping styles affect between SRC and SC. ***P < 0.001.
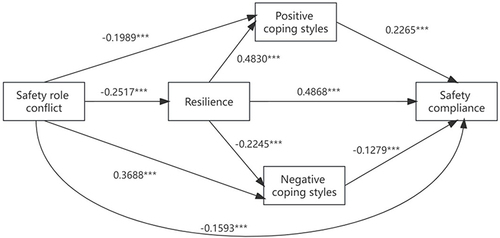
Figure 4 Mediating roles of resilience and coping styles affect between ISC and SC. ***P < 0.001.
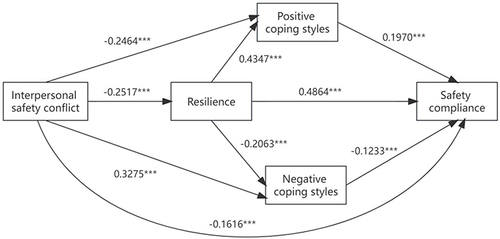
Figure 5 Mediating roles of resilience and coping styles affect between SRA and SP. ***P < 0.001.

Figure 6 Mediating roles of resilience and coping styles affect between SRC and SP. ***P < 0.001.
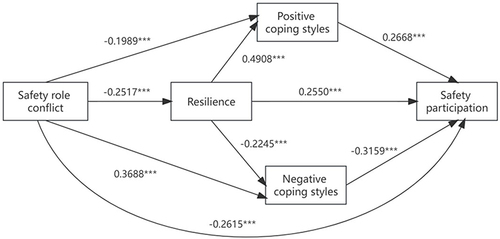
Figure 7 Mediating roles of resilience and coping styles affect between ISC and SP. ***P < 0.001.
