Figures & data
Table 1 Sociodemographic Variables (N = 343)
Table 2 Model Fit Indices of the Single-Factor Model for the WHO-5-C (N = 343)
Table 3 Cross-Sectional Measurement Invariances of the WHO-5-C (N = 343)
Table 4 Longitudinal Measurement Invariances of the WHO-5-C (N = 343)
Figure 1 Inter-item and item-total correlations between the Chinese WHO-5, PHQ-4, and SRHQ (N=343).
Abbreviations: WHO-5, World Health Organization-Five Well-Being Index; WHO01-05, item 01–05 of the WHO-5; PHQ-2, Patient Health Questionnaire-2; GAD-2, Generalized Anxiety Disorder-2; PHQ-4, Patient Health Questionnaire-4; SRHQ, Self-Rated Health Questionnaire; T1, Time 1; T2, Time 2.
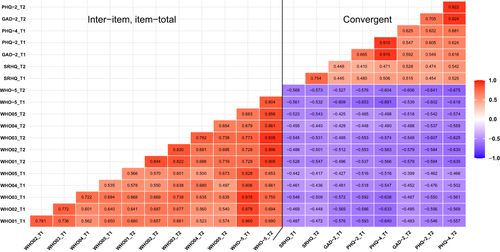
Table 5 Internal Consistency and Test–Retest Reliability of the WHO-5-C, SRHQ, and PHQ-4-C (N = 343)
Table 6 Sensitivity and Specificity of the WHO-5-C for Identifying Well-Being in Healthcare Students (N = 343)
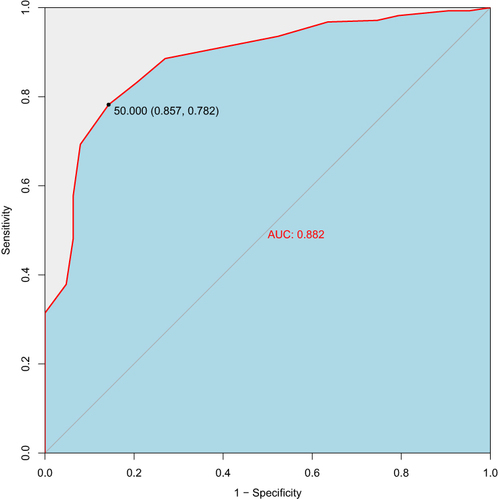
Figure 2 ROC curve of the Chinese WHO-5 for well-being (N=343).
Abbreviations: WHO-5, World Health Organization-Five Well-Being Index; ROC, receiver operating characteristic; AUC, area under the curve.