
Figures & data
Table 1 Analysis of Differences in Demographics (X±s) of the Two Groups of Subjects
Table 2 Scores of the Two Groups in the Subscales (X±s) and Pretest-Posttest Comparison
Table 3 Results of Repeated Measures ANOVA of the Subscale of the Two Groups
Figure 1 FMI scores of two groups in pre- and post- intervention.
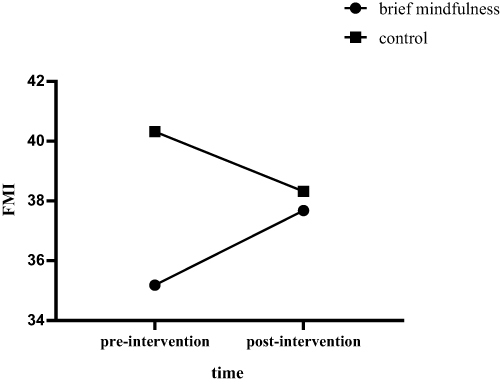
Figure 2 MPATS scores of two groups in pre- and post- intervention.
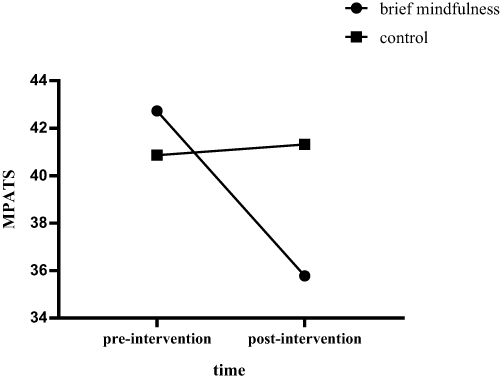
Figure 3 C-MLQ scores of two groups in pre- and post- intervention.
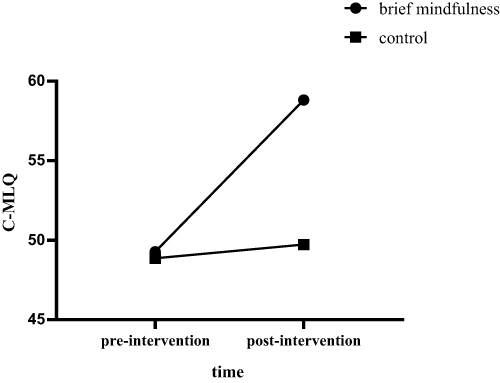
Table 4 Analysis of the Mediating Effect of Meaning in Life