
Figures & data
Figure 1 Google Trends-based NSSI hit-search volume over the years (from 2004 to 2012).
Notes: NSSI hit-search volume over the years 2004–2012 (top), a map of Italian towns with higher flux volumes (bottom, left), and a list of the most searched NSSI-related terms (bottom, right).
Abbreviation: NSSI, non-suicidal self-injury.
Abbreviation: NSSI, non-suicidal self-injury.
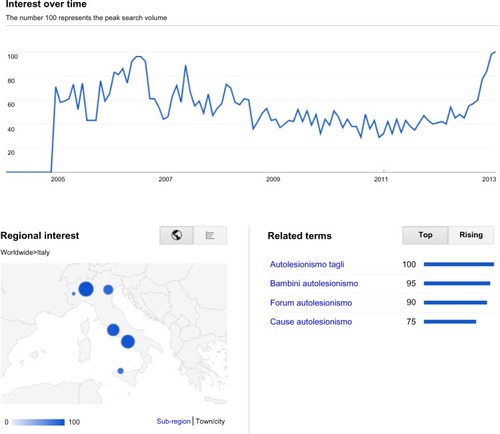
Figure 2 Autocorrelation plot for the NSSI hit-search and partial autocorrelation plot, showing a regular cyclical pattern.
Abbreviations: ACF, autocorrelation function; NSSI, non-suicidal self-injury; PACF, Partial autocorrelation function.
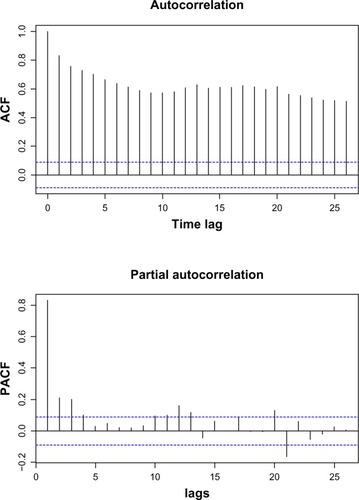
Figure 3 Pearson’s correlation plots for some of the most important NSSI-related hit search terms.
Abbreviation: NSSI, non-suicidal self-injury.
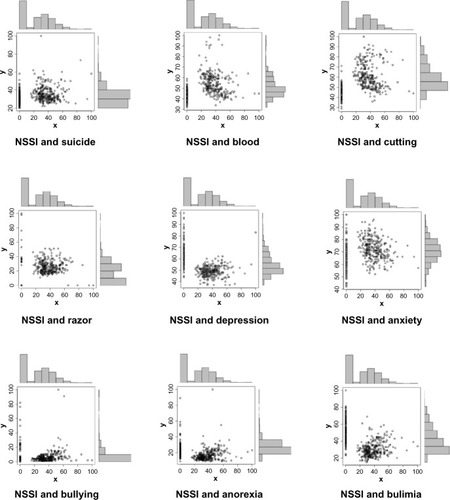
Table 1 A list of the towns with higher normalized NSSI hit-search flux volumes
Table 2 Pearson’s correlation coefficients for different hit search volumes related to NSSI and their statistical significance according to their two-tailed P-value