
Figures & data
Table 1 Descriptive of Sample
Table 2 Measurement Items
Figure 1 The overall estimated model.
Notes: Model fit: SRMR = 0.061; β = standardized path coefficients; R2= coefficient of determination; solid line indicated significant path coefficient; ***p < 0.001. **p < 0.01.
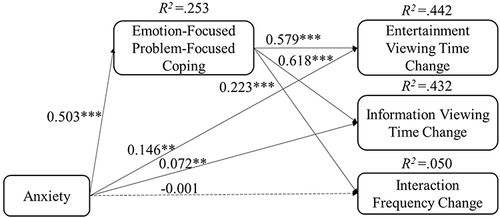
Table 3 Multi-Group Analysis Based on Lockdown Duration via Either EPC or PFC