Figures & data
Table 1 Valence, Arousal, Familiarity and Social Media Relevant Scores of Stimuli Pictures (M±SD)
Figure 1 The sequence of events in the experimental trial and an example of standard stimuli and deviant stimuli (high social media). Each trial presented a single stimulus.
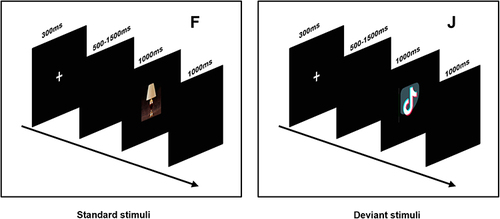
Figure 2 (A) RT and ACC for standard and deviant stimuli; (B) RT and ACC for picture types (HSM, LSM and neutral) in the deviant stimuli.
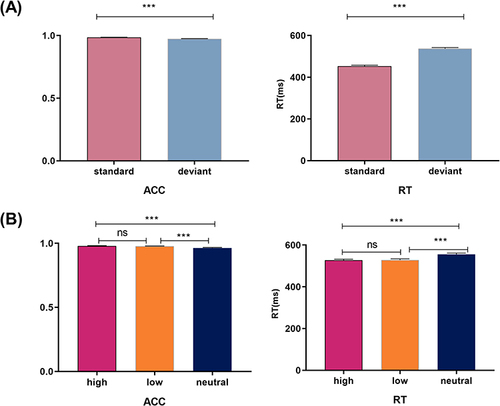
Figure 3 (A) The grand means of the difference ERP waveforms of the high social media, low social media and neutral pictures. Difference ERPs were calculated by averaging the data at the electrodes of Fz, Cz, FCz, and Pz; (B) Topographic maps for P3 (370-600ms) and N2 (240-320ms).
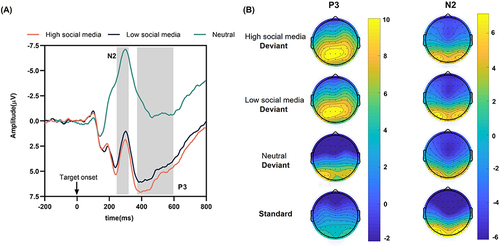
Figure 4 (A and B) Regression analyses between PSMU and N2 amplitudes; (C and D) Regression analyses between PSMU and P3 amplitudes.
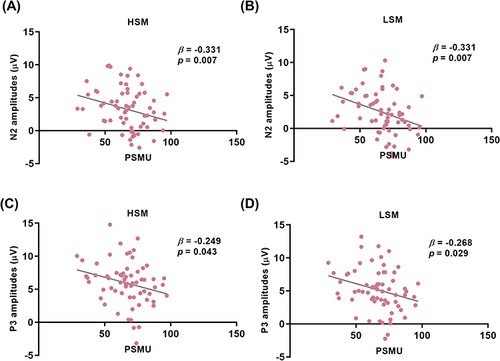
Table 2 Descriptive Statistics and Correlation Analysis of Each Variable (N = 66)
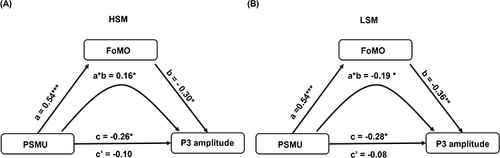
Table 3 Mediating Effect Test of FoMO in the HSM Pictures (N = 66)
Table 4 Mediating Effect Test of FoMO in the LSM Pictures (N = 66)
Figure 5 (A) Theoretical model of the role of FoMO in the relationship between PSMU and P3 amplitude (HSM); (B)Theoretical model of the role of FoMO in the relationship between PSMU and P3 amplitude (LSM).