Figures & data
Figure 1 The hypothesis model.
Abbreviations: SPA, smart phone addiction; IC, interpersonal competence; NE, negative emotion; PR, Psychological Resilience.
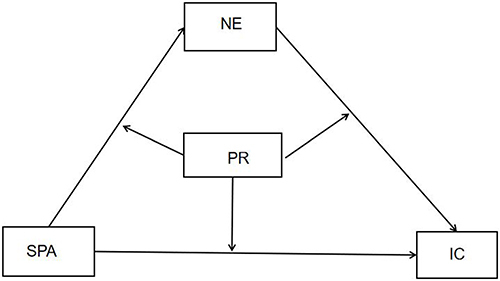
Table 1 Descriptive Statistics and Correlations Among Variables
Table 2 Mediating Effect and 95% Confidence Interval Estimated by the Bootstrap Method
Table 3 The Test of the Moderated Mediation Model
Figure 2 A moderated mediation model.
Notes:*p<0.05,*** p<0.001.
Abbreviations: IC, Interpersonal Competence; SPA, Smart Phone Addiction; NE, Negative Emotion; PR, Psychological Resilience; IR, initiating relationship; ADWO, asserting displeasure with others; DPI, disclosing personal information; MIC, managing interpersonal conflict; PESAA, providing emotional support and advice.
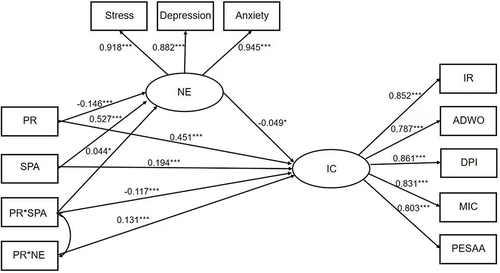
Figure 3 The moderation of PR to SPA and IC.
Abbreviations: IC, Interpersonal Competence; LSPA, Low Smart Phone Addiction; MSPA, Middle Smart Phone Addiction; HSPA, High Smart Phone Addiction; LPR, Low Psychological Resilience; MPR, Middle Psychological Resilience; HPR, High Psychological Resilience.
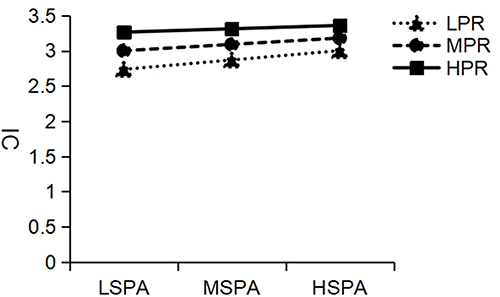
Figure 4 The moderation of PR to SPA and NE.
Abbreviations: NE, Negative Emotion; LSPA, Low Smart Phone Addiction; MSPA, Middle Smart Phone Addiction; HSPA, High Smart Phone Addiction; LPR, Low Psychological Resilience; MPR, Middle Psychological Resilience; HPR, High Psychological Resilience.
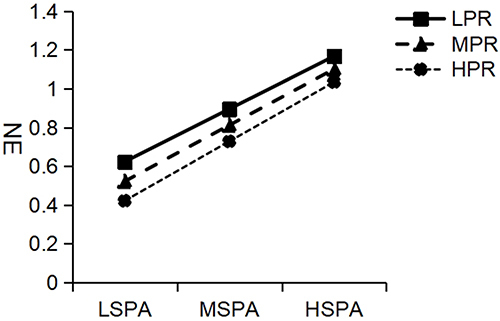
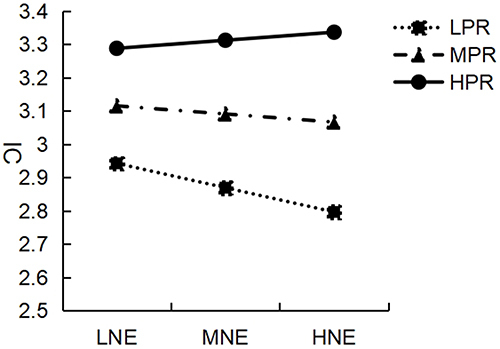
Figure 5 The moderation of PR to NE and IC.
Abbreviations: IC, Interpersonal Competence.; LNE, Low Negative Emotion; MNE, Middle Negative Emotion; HNE, High Negative Emotion; LPR, Low Psychological Resilience; MPR, Middle Psychological Resilience; HPR, High Psychological Resilience.