Figures & data
Table 1 Monoamine Receptor Genes Affected by MP
Table 2 Common Post Synaptic Density Genes Affected by MP
Table 3 Summary Results for MP on Gene Expression
Figure 1 MP pharmacological mechanism of action. A schematic depiction showing presynaptic neurons releasing neurotransmitters into the synapse, the post-synaptic neuron and receptors, and resulting in the elicitation of a response. MP inhibits the reuptake of these transporters on the pre-synaptic neuron, causing the synaptic concentrations of these neurotransmitters to be increased. The image on the far left, in red, shows the effect of MP increasing dopamine in the synaptic cleft. The middle image, in green, shows the same process that occurs with serotonin increasing in the synapse, and the far right, in orange, shows norepinephrine increasing in concentration in the synapse due to MP inhibiting the reuptake transporters.
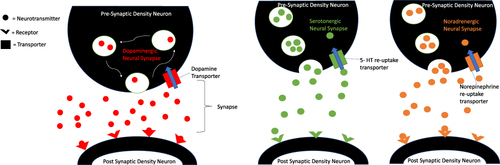
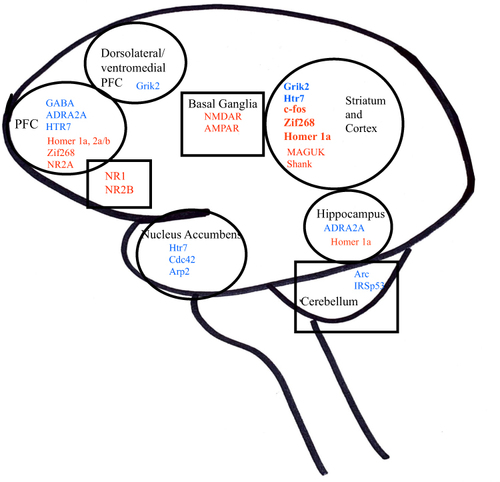
Figure 2 MP on gene expression, both region and gene specific: circle = upregulated, square = downregulated; black = region of the brain, blue = monoamine neurotransmitter genes and receptors, red = postsynaptic density protein genes.