Figures & data
Figure 1 The experiment procedure.
Notes: (A) The five experimental stages along with the complete set of stimuli employed in the experiment, encompassing three conditioned stimuli (CS), including CS threat (CSt), CS reversal (CSr) and CS safe (CSs), and the six generalization stimuli (GS) and six new GSs (NGS), US refers to the unconditioned stimulus. (B) The schematic representation of stimuli presentation during the experiment.
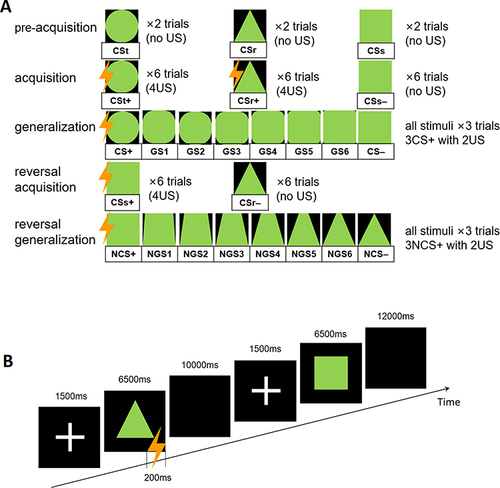
Table 1 Overview of the Characteristics of the Two Participant Groups
Figure 2 US expectancy ratings for CS.
Notes: Including three stages: pre-acquisition, acquisition, and reversal acquisition. During the acquisition stage, significant differences were observed in both groups for CSt vs. CSs and CSr vs. CSs, specifically at trial 6. Similarly, in the reversal acquisition stage, both groups displayed significant differences in US expectancy ratings between CSs and CSr. ***p < 0.001.
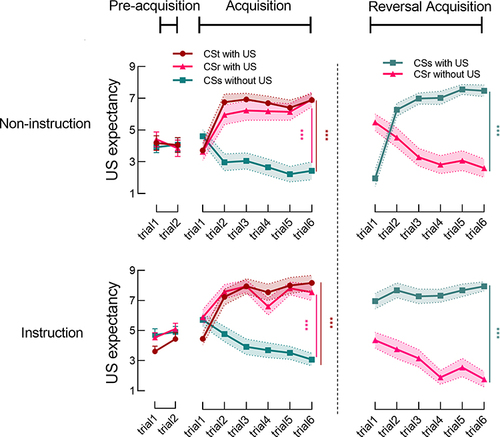
Figure 3 US expectancy ratings for the generalization and reversal generalization stages.
Notes: The mean US expectancy ratings across three trials for stimuli during both the generalization and reversal generalization stages. No significant differences in US expectancy ratings between GS and NGS stimuli were observed in either the non-instruction or instruction groups.
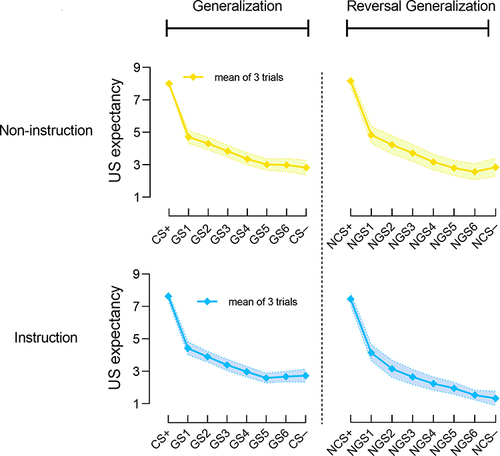
Figure 4 The latent variable mediation pathways for both groups.
Notes: (A) represents the instruction group, with the path from GS to NGS through IU found to be significant. (B) represents the non-instruction group, with the same path not found to be significant.
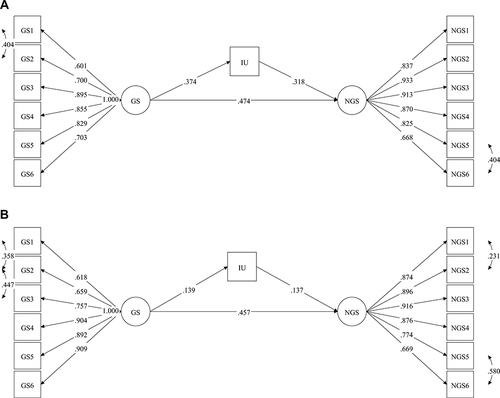
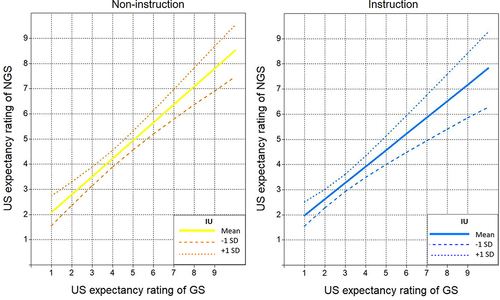
Figure 5 The regression lines of GS on NGS in two groups.
Notes: The regression lines for IU lower than 1 standard deviation (SD) below the mean and higher than 1 SD above the mean.