Figures & data
Figure 1 Machine learning techniques and study design.
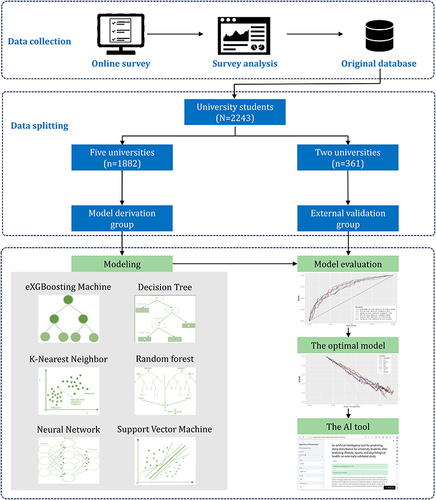
Table 1 Participant’s Baseline Characteristics
Table 2 Prediction Performance of All Models in the External Validation Group
Figure 2 The area under the curve for each model.
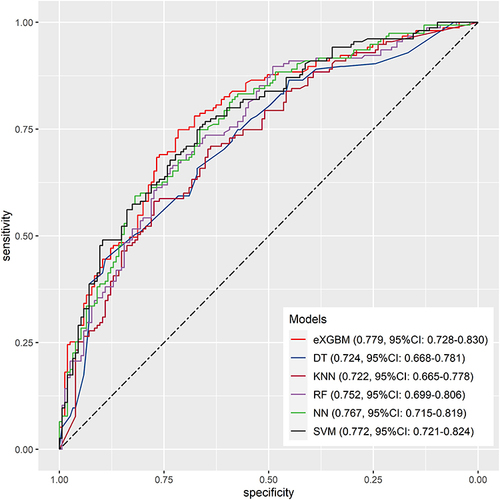
Figure 3 Calibration curve for each model.
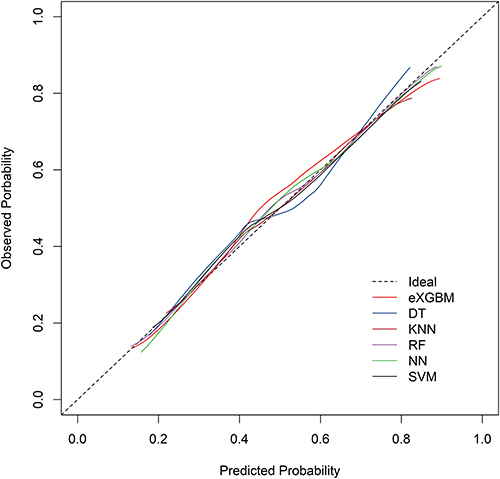
Figure 4 Decision curve analysis for each model.
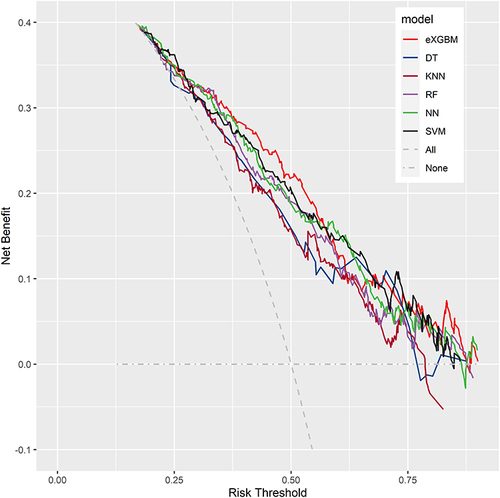
Figure 5 The Shapley Additive exPlanations (SHAP) analysis based on the eXGBM model. (A) The association between age and its SHAP value in the model derivation group; (B) The association between age and its SHAP value in the model external validation group; (C) The association between stress score and its SHAP value in the model derivation group; (D) The association between stress score and its SHAP value in the model external validation group; (E) Feature importance analysis in the model derivation group; (F) Feature importance analysis in the model external validation group.
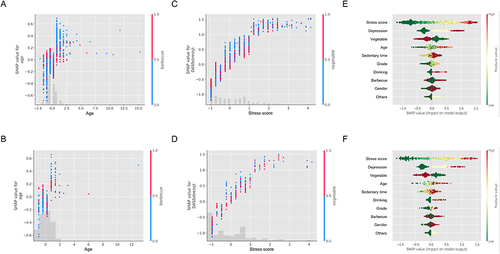
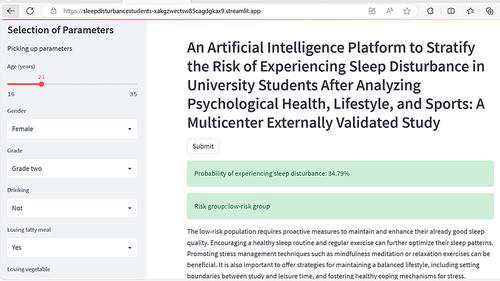
Figure 6 The web-based artificial intelligence model. The user interface was meticulously designed to facilitate the input of relevant patient data and provide efficient access to predicted probabilities. It featured intuitive panels for selecting model parameters, performing probability calculations, and accessing comprehensive information about the underlying model.