
Figures & data
Table 1 Descriptive Statistics of Participants (N = 191)
Table 2 Descriptive Statistics and Correlation Matrix of Main Measures (N= 191)
Table 3 Decomposition of the Effect of Family Functioning on Depression (N= 191)
Figure 1 Standardized path coefficients for the mediating model.
Notes: *p < 0.05; **p < 0.01; ***p < 0.001.
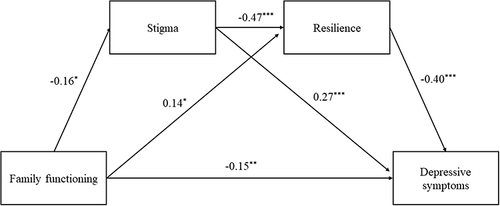
Table 4 Sensitivity Analysis (N= 150)