
Figures & data
Table 1 Factor Loadings of EHQ
Figure 1 Standardized path coefficient of 3 factors model: f1: positive contact. f2: refusal to separate. f3: homesickness behavior.
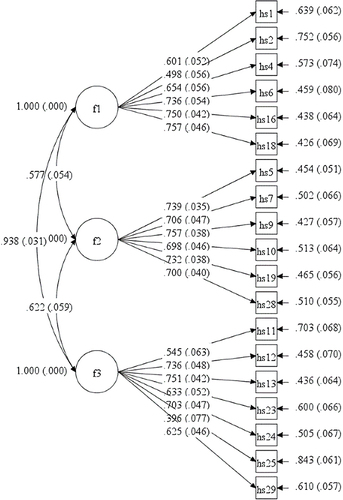
Figure 2 Standardized path coefficient of modified 3 factors model: Correlation between the residuals of hs 19 and hs 28 was set. f1: positive contact. f2: refusal to separate. f3: homesickness behavior.
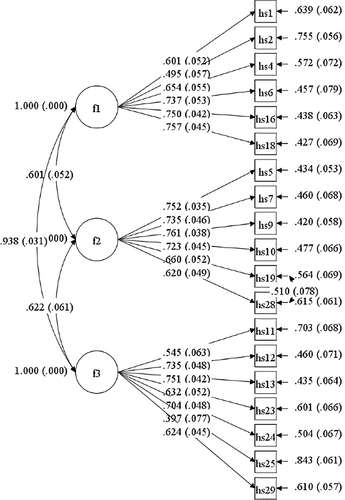
Table 2 The Measurement Invariance Test for Different Gender
Table 3 The measurement invariance test for different educational attainment
Table 4 Criterion-related validity of EHQ
Table 5 Reliability Coefficients of EHQ
Table 6 The Fitting Indices of the Latent Profile Models for Different Numbers of Classes
Figure 3 Latent profiles for different numbers of class: The distribution of scores in each group under different class solutions is described from left to right. hsf1: positive contact. hsf2: refusal to separate. hsf3: homesickness behavior.
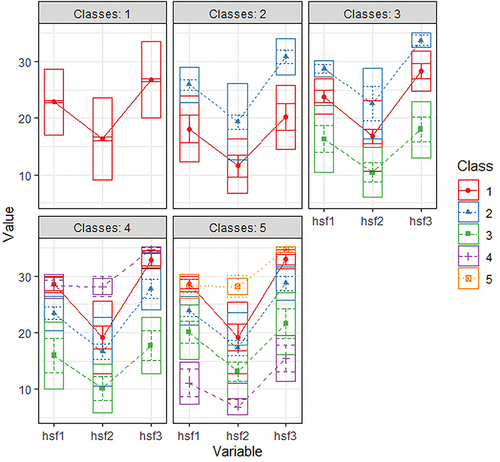
Table 7 Comparison of Differences in Homesickness Between 4 Homesickness Classes
Table 8 Chi-Square Test Between 4 Homesickness Classes and Demographic Information