Figures & data
Table 1 General Characteristics of the Participants (N=322)
Table 2 Correlations Between Study Variables
Table 3 Hierarchical Regression Examining the Effect of Resilience on the Relationship Between Stigma and Illness Identity (N=322)
Table 4 The Bootstrap Results of Mediation Analysis
Figure 1 The mediation model of stigma, resilience, illness identity (acceptance, enrichment, engulfment). a The effect of stigma on resilience; b The effect of resilience on illness identity; c The total effect of stigma on illness identity; c’ The direct effect of stigma on illness identity; ***p < 0.001, *p<0.05. Unstandardized beta coefficients were reported.
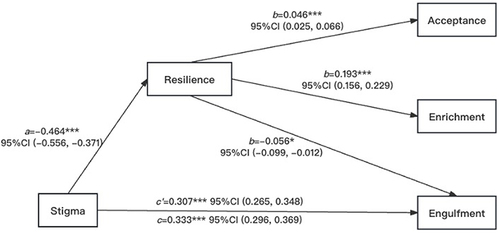
Table 5 The Bootstrap Results of Moderating Effect
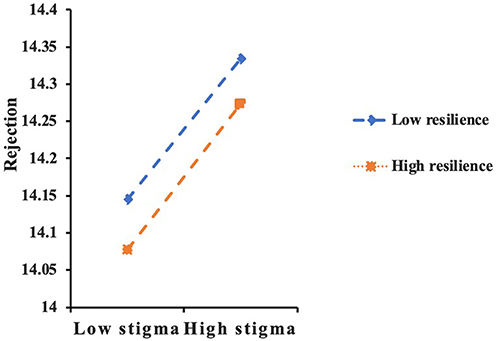
Figure 2 Moderating effect of resilience on the pathway from stigma to rejection.