
Figures & data
Table 1 The Basic Demographic Characteristics of the Study Subjects (n=2993)
Table 2 Variable Correlation Analysis
Figure 1 The chain mediating pathway of T2 anxiety and depressive symptoms on T1 PSU and T3 sleep quality; The model corrected for baseline factors like sex, age, place of origin, family economic status, ethnicity, academic pressure, parents’ marital status, the respondents’ relationships with their families, classmates, and teachers, smoked and drank alcohol consumption; ***P<0.001, **P<0.01, *P<0.05.
Abbreviation: PSU, problematic smartphone use.
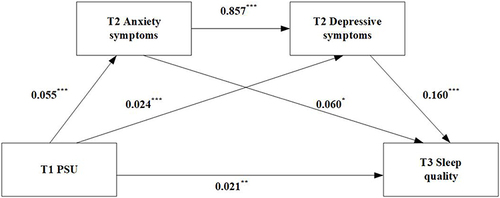
Table 3 The Effect of T1 PSU on T3 Sleep Quality: Serial Mediating Effects of T2 Anxiety and Depressive Symptoms (n=1807)a