
Figures & data
Table 1 Demographic Characteristics and Scale Scores of the Sample (n=2182)
Table 2 Item Analysis (M±SD) and Item-Total Score Correlations (r) of the SCBES
Table 3 Cronbach’s α and Test–Retest Reliability of the SCBES
Table 4 Varimax Rotated Factor Loadings of the SCBES (n=1091)
Table 5 Model Fit Between the Three-Factor and One-Factor Models of the SCBES (n=1091)
Figure 1 Factor structure of the three-factor model for the Simplified Chinese version of BES (SCBES). Factor 1=Binge-eating behaviors, Factor 2=Lack of control, Factor 3=Negative affects related to overeating.
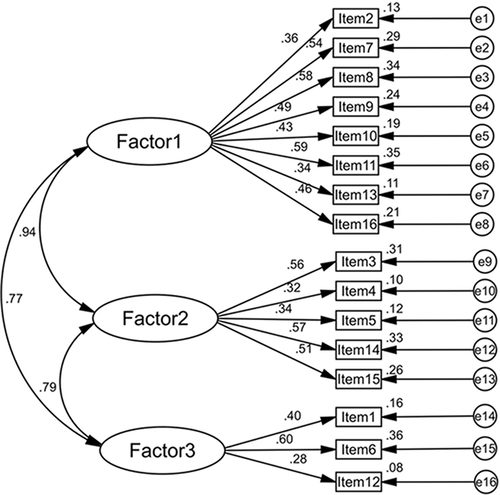
Table 6 Pearson Correlations (r) Between the SCBES, the BEDS-7, and Binge-Eating Episodes (n=2182)
Figure 2 The receiver operating characteristic (ROC) curve that displayed the accuracy of the Simplified. Chinese version of BES (SCBES) as a screening tool for objective severity of binge-eating symptoms, with an area under the curve (AUC) of 0.935 (95% CI = 0.916–0.953, p < 0.001, n = 2182).
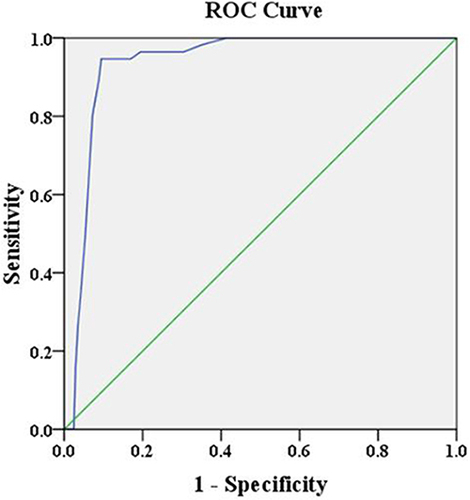
Table 7 Multivariate Linear Regression Analysis for the SCBES Total Score (n=2182)
Data Sharing Statement
Data could be obtained by contacting the corresponding author.